Natural Gas Prices - Historical Chart
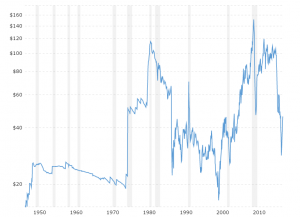
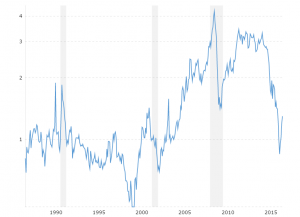
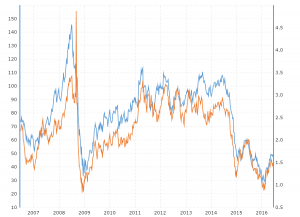
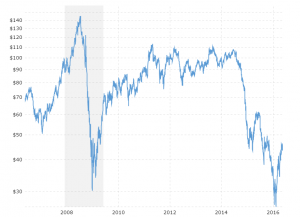
Interactive chart illustrating the history of Henry Hub natural gas prices. The prices shown are in U.S. dollars. The current price of natural gas as of March 31, 2025 is $4.11.
| Henry Hub Natural Gas Spot Price - Historical Annual Data | ||||||
|---|---|---|---|---|---|---|
| Year | Average Closing Price |
Year Open | Year High | Year Low | Year Close | Annual % Change |
| 2025 | $4.14 | $3.65 | $9.86 | $2.93 | $4.11 | 20.88% |
| 2024 | $2.19 | $2.56 | $13.20 | $1.21 | $3.40 | 31.78% |
| 2023 | $2.53 | $3.64 | $3.78 | $1.74 | $2.58 | -26.70% |
| 2022 | $6.45 | $3.74 | $9.85 | $3.46 | $3.52 | -7.85% |
| 2021 | $3.89 | $2.60 | $23.86 | $2.43 | $3.82 | 61.86% |
| 2020 | $2.03 | $2.05 | $3.14 | $1.33 | $2.36 | 12.92% |
| 2019 | $2.56 | $3.25 | $4.25 | $1.75 | $2.09 | -35.69% |
| 2018 | $3.15 | $6.24 | $6.24 | $2.49 | $3.25 | -11.92% |
| 2017 | $2.99 | $3.71 | $3.71 | $2.44 | $3.69 | -0.54% |
| 2016 | $2.52 | $2.28 | $3.80 | $1.49 | $3.71 | 62.72% |
| 2015 | $2.62 | $3.01 | $3.32 | $1.63 | $2.28 | -27.39% |
| 2014 | $4.37 | $4.32 | $8.15 | $2.74 | $3.14 | -27.15% |
| 2013 | $3.73 | $3.30 | $4.52 | $3.08 | $4.31 | 25.66% |
| 2012 | $2.75 | $2.97 | $3.77 | $1.82 | $3.43 | 15.10% |
| 2011 | $4.00 | $4.54 | $4.92 | $2.84 | $2.98 | -29.38% |
| 2010 | $4.37 | $6.09 | $7.51 | $3.18 | $4.22 | -27.49% |
| 2009 | $3.94 | $5.41 | $6.10 | $1.83 | $5.82 | 3.37% |
| 2008 | $8.86 | $7.83 | $13.31 | $5.37 | $5.63 | -20.82% |
| 2007 | $6.97 | $5.40 | $9.14 | $5.30 | $7.11 | 29.27% |
| 2006 | $6.73 | $9.90 | $9.90 | $3.66 | $5.50 | -42.23% |
| 2005 | $8.69 | $5.53 | $15.39 | $5.53 | $9.52 | 58.14% |
| 2004 | $5.89 | $6.28 | $8.12 | $4.32 | $6.02 | 4.51% |
| 2003 | $5.47 | $4.93 | $18.48 | $3.98 | $5.76 | 25.49% |
| 2002 | $3.38 | $2.55 | $5.31 | $2.03 | $4.59 | 91.25% |
| 2001 | $3.96 | $9.97 | $10.31 | $1.69 | $2.40 | -77.10% |
| 2000 | $4.31 | $2.16 | $10.49 | $2.16 | $10.48 | 355.65% |
| 1999 | $2.27 | $2.10 | $3.10 | $1.63 | $2.30 | 17.95% |
| 1998 | $2.09 | $2.16 | $2.65 | $1.05 | $1.95 | -14.10% |

