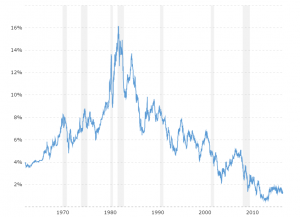
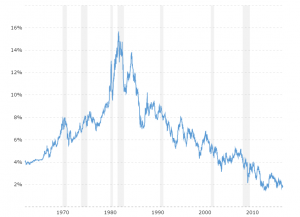
1 Year LIBOR Rate - Historical Chart
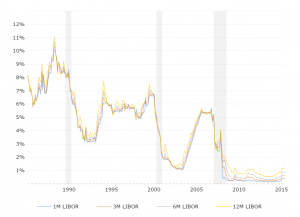
Interactive chart of the 12 month LIBOR rate back to 1986. The London Interbank Offered Rate is the average interest rate at which leading banks borrow funds from other banks in the London market. LIBOR is the most widely used global "benchmark" or reference rate for short term interest rates. The current 1 year LIBOR rate as of December 31, 1969 is 0.00%.
| 12 Month LIBOR - Historical Annual Yield Data | ||||||
|---|---|---|---|---|---|---|
| Year | Average Yield | Year Open | Year High | Year Low | Year Close | Annual % Change |
| 2020 | 0.97% | 1.99% | 1.99% | 0.43% | 0.43% | -78.65% |
| 2019 | 2.37% | 3.00% | 3.04% | 1.85% | 2.00% | -33.75% |
| 2018 | 2.76% | 2.11% | 3.14% | 2.11% | 3.01% | 43.00% |
| 2017 | 1.79% | 1.69% | 2.11% | 1.68% | 2.11% | 24.99% |
| 2016 | 1.38% | 1.17% | 1.70% | 1.12% | 1.69% | 43.10% |
| 2015 | 0.79% | 0.63% | 1.18% | 0.61% | 1.18% | 87.34% |
| 2014 | 0.56% | 0.58% | 0.63% | 0.53% | 0.63% | 8.41% |
| 2013 | 0.68% | 0.84% | 0.84% | 0.57% | 0.58% | -30.95% |
| 2012 | 1.01% | 1.13% | 1.13% | 0.84% | 0.84% | -25.66% |
| 2011 | 0.83% | 0.78% | 1.13% | 0.72% | 1.13% | 44.87% |
| 2010 | 0.92% | 0.99% | 1.22% | 0.76% | 0.78% | -20.41% |
| 2009 | 1.57% | 2.02% | 2.30% | 0.96% | 0.98% | -51.00% |
| 2008 | 3.09% | 4.19% | 4.23% | 2.00% | 2.00% | -52.61% |
| 2007 | 5.12% | 5.34% | 5.51% | 4.22% | 4.22% | -20.83% |
| 2006 | 5.33% | 4.85% | 5.77% | 4.79% | 5.33% | 10.12% |
| 2005 | 4.03% | 3.11% | 4.88% | 3.11% | 4.84% | 56.13% |
| 2004 | 2.12% | 1.48% | 3.12% | 1.28% | 3.10% | 112.33% |
| 2003 | 1.36% | 1.46% | 1.63% | 0.99% | 1.46% | 0.69% |
| 2002 | 2.20% | 2.40% | 3.08% | 1.44% | 1.45% | -40.57% |
| 2001 | 3.85% | 5.94% | 5.94% | 2.06% | 2.44% | -59.33% |
| 2000 | 6.87% | 6.60% | 7.50% | 5.95% | 6.00% | -7.69% |
| 1999 | 5.72% | 5.09% | 6.50% | 5.00% | 6.50% | 27.45% |
| 1998 | 5.54% | 5.94% | 5.99% | 4.69% | 5.10% | -14.57% |
| 1997 | 6.00% | 5.81% | 6.44% | 5.43% | 5.97% | 3.11% |
| 1996 | 5.78% | 5.38% | 6.31% | 5.00% | 5.79% | 6.63% |
| 1995 | 6.24% | 7.81% | 7.81% | 5.43% | 5.43% | -29.94% |
| 1994 | 5.61% | 3.88% | 7.75% | 3.69% | 7.75% | 103.41% |
| 1993 | 3.69% | 4.06% | 4.13% | 3.44% | 3.81% | -6.16% |
| 1992 | 4.25% | 4.31% | 5.26% | 3.25% | 4.06% | -5.80% |
| 1991 | 6.35% | 7.50% | 7.63% | 4.31% | 4.31% | -42.99% |
| 1990 | 8.45% | 8.25% | 9.38% | 7.50% | 7.56% | -8.36% |
| 1989 | 9.31% | 9.69% | 11.38% | 8.06% | 8.25% | -14.33% |
| 1988 | 8.41% | 7.88% | 9.75% | 7.06% | 9.63% | 22.21% |
| 1987 | 7.63% | 6.25% | 9.88% | 6.06% | 7.88% | 24.88% |

