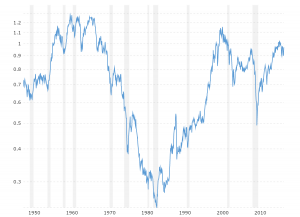
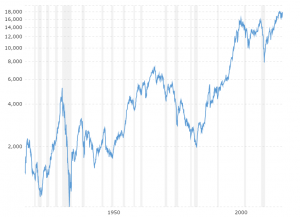
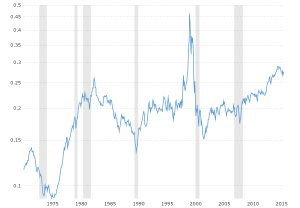
Hang Seng Composite Index - 30 Year Historical Chart
Interactive daily chart of the Hong Kong Hang Seng Composite stock market index back to 1986. Each data point represents the closing value for that trading day and is denominated in hong kong dollars (HKD). The current price is updated on an hourly basis with today's latest value. The current price of the Hang Seng Composite Index as of December 31, 1969 is 0.00.
| Hang Seng Composite Index - Historical Annual Data | ||||||
|---|---|---|---|---|---|---|
| Year | Average Closing Price |
Year Open | Year High | Year Low | Year Close | Annual % Change |
| 2025 | 19,601.26 | 19,623.32 | 20,225.11 | 18,874.14 | 20,225.11 | 0.82% |
| 2024 | 18,054.70 | 16,788.55 | 23,099.78 | 14,961.18 | 20,059.95 | 17.67% |
| 2023 | 19,019.25 | 20,145.29 | 22,688.90 | 16,201.49 | 17,047.39 | -13.82% |
| 2022 | 20,316.90 | 23,274.75 | 24,965.55 | 14,687.02 | 19,781.41 | -15.46% |
| 2021 | 27,102.31 | 27,472.81 | 31,084.94 | 22,744.86 | 23,397.67 | -14.08% |
| 2020 | 25,282.77 | 28,543.52 | 29,056.42 | 21,696.13 | 27,231.13 | -3.40% |
| 2019 | 27,581.81 | 25,130.35 | 30,157.49 | 25,064.36 | 28,189.75 | 9.07% |
| 2018 | 28,850.94 | 30,515.31 | 33,154.12 | 24,585.53 | 25,845.70 | -13.61% |
| 2017 | 26,190.41 | 22,150.40 | 30,003.49 | 22,134.47 | 29,919.15 | 35.99% |
| 2016 | 21,433.92 | 21,327.12 | 24,099.70 | 18,319.58 | 22,000.56 | 0.39% |
| 2015 | 24,304.88 | 23,857.82 | 28,442.75 | 20,556.60 | 21,914.40 | -7.16% |
| 2014 | 23,230.52 | 23,340.05 | 25,317.95 | 21,182.16 | 23,605.04 | 1.28% |
| 2013 | 22,604.13 | 23,311.90 | 24,038.55 | 19,813.90 | 23,306.39 | 2.87% |
| 2012 | 20,471.62 | 18,877.40 | 22,666.50 | 18,185.50 | 22,656.90 | 22.91% |
| 2011 | 21,394.85 | 23,436.00 | 24,419.60 | 16,250.20 | 18,434.30 | -19.97% |
| 2010 | 21,506.54 | 21,823.28 | 24,964.37 | 18,985.50 | 23,035.40 | 5.32% |
| 2009 | 18,106.04 | 15,042.81 | 22,943.98 | 11,344.58 | 21,872.50 | 52.02% |
| 2008 | 20,889.58 | 27,560.52 | 27,615.85 | 11,015.84 | 14,387.48 | -48.27% |
| 2007 | 23,195.96 | 20,310.18 | 31,638.22 | 18,664.88 | 27,812.65 | 39.31% |
| 2006 | 16,885.42 | 14,944.77 | 20,001.91 | 14,944.77 | 19,964.72 | 34.20% |
| 2005 | 14,352.59 | 14,237.42 | 15,466.06 | 13,355.23 | 14,876.43 | 4.54% |
| 2004 | 12,918.46 | 12,801.48 | 14,266.38 | 10,967.65 | 14,230.14 | 13.15% |
| 2003 | 10,290.34 | 9,365.52 | 12,594.42 | 8,409.01 | 12,575.94 | 34.92% |
| 2002 | 10,453.83 | 11,350.85 | 11,974.61 | 8,858.69 | 9,321.29 | -18.21% |
| 2001 | 12,553.25 | 14,869.94 | 16,163.99 | 8,934.20 | 11,397.21 | -24.50% |
| 2000 | 16,045.83 | 17,369.63 | 18,301.69 | 13,722.70 | 15,095.53 | -11.00% |
| 1999 | 12,734.57 | 9,809.17 | 16,962.10 | 9,076.33 | 16,962.10 | 68.80% |
| 1998 | 9,418.33 | 10,680.60 | 11,810.60 | 6,660.42 | 10,048.58 | -6.29% |
| 1997 | 13,375.56 | 13,203.40 | 16,673.30 | 9,059.90 | 10,722.80 | -20.29% |
| 1996 | 11,474.44 | 10,204.90 | 13,531.00 | 10,204.90 | 13,451.50 | 33.53% |
| 1995 | 9,010.28 | 7,844.10 | 10,073.40 | 6,967.90 | 10,073.40 | 22.98% |
| 1994 | 9,532.10 | 12,086.50 | 12,201.10 | 7,707.80 | 8,191.00 | -31.10% |
| 1993 | 7,459.14 | 5,437.80 | 11,888.40 | 5,437.80 | 11,888.40 | 115.67% |
| 1992 | 5,479.33 | 4,301.80 | 6,447.10 | 4,301.80 | 5,512.40 | 28.28% |
| 1991 | 3,798.10 | 3,031.00 | 4,297.30 | 2,984.00 | 4,297.30 | 42.11% |
| 1990 | 3,032.66 | 2,838.10 | 3,559.00 | 2,736.60 | 3,024.00 | 6.61% |
| 1989 | 2,792.82 | 2,706.70 | 3,309.60 | 2,093.60 | 2,836.60 | 5.55% |
| 1988 | 2,555.63 | 2,286.30 | 2,772.50 | 2,223.00 | 2,687.40 | 16.70% |
| 1987 | 2,908.02 | 2,540.10 | 3,949.70 | 1,894.90 | 2,302.80 | -10.34% |


