A cash flow statement is a unique artifact of a company’s fiscal outlook. While a balance sheet paints a picture of the value of assets the company possesses, and an income statement illustrates how effectively it acquires new assets, the cash flow statement zooms in on one key asset: money.
As important as inventory or equipment or intellectual property might be to a company’s success, not of this has any bearing on the cash flow statement. And while the company might be scrupulous in generating net income from those assets, that’s not the whole story of how successful it truly is.
Net income is the starting point for the cash flow statement. The company’s cash flow from operations might be higher or lower than net income; that is, the quality of those earnings might be better or worse than the income statement suggests. Meanwhile, cash flows from investing or financing activities might be more significant than their brief appearance on the income statement might indicated.
The cash flow statement, then, is the document that keeps the rest of the financial statements honest. Valuing assets and liabilities on the balance sheet is at times more art than science. Timing the recognition of revenues and expenses also requires more than a little sophistry. But cash is worth exactly what’s printed on its face, and the ultimate goal of any business is to make sure that more of it is coming in than is going out.
Key takeaways
- A company’s cash flow statement shows how changes in other financial statements affect the amount of cash available to it.
- It translates the income statement’s accrual-basis net income figure into a cash-basis net cash flow.
- It states how much cash is awarded to investors in the form of dividends and to executives in the form of stock-based compensation.
- Such non-cash transactions as debt-to-equity conversions are recorded in a cash flow statement’s footnotes.
Cash flow statement defined
A cash flow statement is a report that shows how changes in the income statement or balance sheet affect the amount of cash available to a firm over a given period of time.
That period is driven by how frequently local law or custom requires publicly-traded companies to report their earnings to regulators and investors. Globally, that means every year. In the United States, it also means every quarter — that is, every three months. In most the rest of the world, though, interim reports are required only every six months.
Cash flow statement template
Macrotrends employs a template that provides detail of changes in cash positions based on a company’s operating, investing and financing activities. It is based on the “indirect” method of generating a cash flow statement, by which net income is used as the starting point, then items are added and subtracted until net cash flow is ultimately arrived at. This is distinct from the “direct” method — better suited to small, private businesses — which stems from the beginning and ending balances of the company’s cash accounts.
Adopting this indirect-method template provides readers with apples-to-apples points of comparison between companies that might break out these changes in slightly different manners. While cash flow statements of publicly traded companies must adhere to to International Accounting Standard 7, as promulgated by the FISB Foundation, or in the U.S. by Financial Accounting Standard Board Statement No. 95, companies are afforded a degree of latitude.
To illustrate this template, we’ll use the example of packaged food manufacturer Kellogg’s.
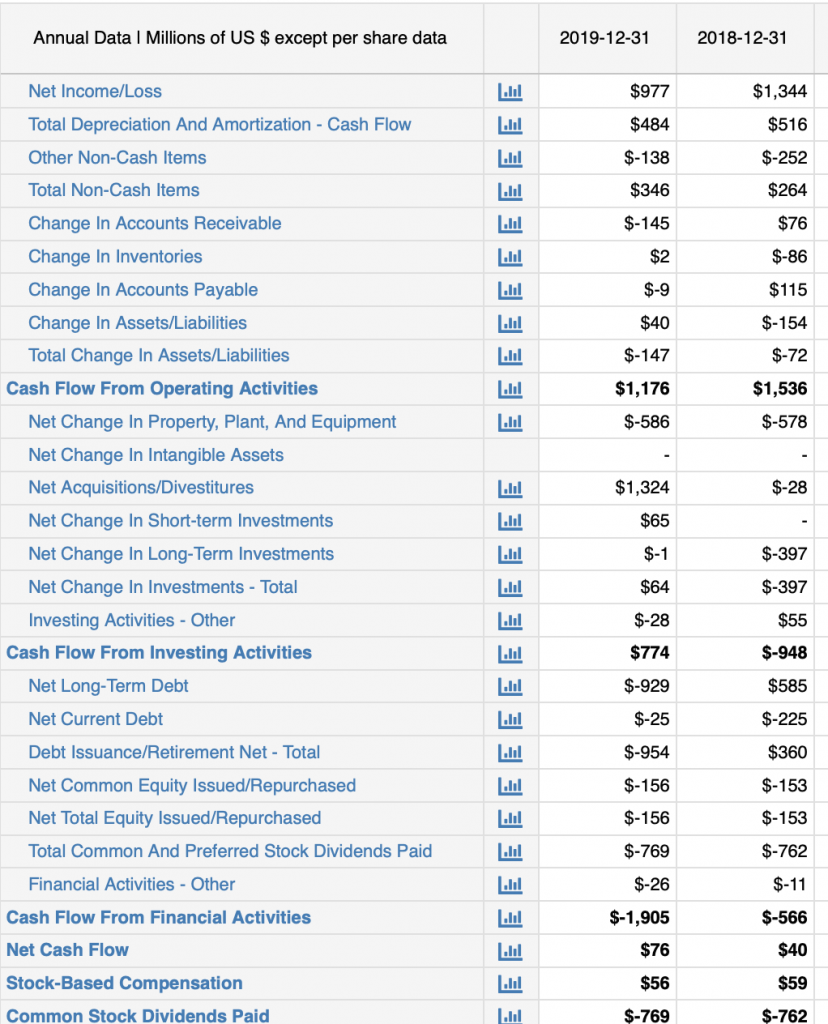
The first thing you’ll notice is that net income — the famous “bottom line” of the income statement, is the top line of the cash flow statement. Maybe that’s where the earnings model ends, but it’s where the analysis of cash flow begins. From there, we add back non-cash charges and subtract out instances where cash has been converted into other accounts.
We start with cash flow from operating activities. The first items relate to the income statement, which includes expenses that don’t reduce the amount of cash available to the business. A more business-savvy way of expressing this is that this section of the cash flow statement takes the earnings reported on an accrual basis via the income statement and restates it on a cash basis.
Depreciation and Amortization: These are non-cash charges which lessen earnings on the income statement, deducting the value of tangible (depreciation) and intangible (amortization) assets due to age and use. Because these effect earnings but not cash flow, their value must be added in here.
Other Non-Cash Items: This refers to charges to the income statement for the value of brands or of “goodwill” which, in accountant-speak, is the premium a company paid to acquire a business above what its book value is.
Total Non-Cash Items: This is the sum of the above two lines.
Continuing with cash flow from operations, we take a look at year-over-year changes to the balance sheet which would have an effect on how much cash is available.
Changes in Accounts Receivable: If a company’s receivables increased over the previous period, that suggests it has that much less cash on hand.
Changes in Inventories: If a company’s inventories increased over the previous period, that suggests it has that much less cash on hand.
Changes in Accounts Payable: If a company’s payables increased over the previous year, that suggests it has that much more cash on hand.
Change in Other Assets/Liabilities: If a company’s other net assets increased over the previous period, that suggests it has that much less cash on hand; if its net assets decreased, that suggests it has that much more cash on hand.
Total Changes in Assets/Liabilities: This is the sum of the above four lines.
Cash Flow From Operations: This is the sum of Net Income, Total Non-Cash Items and Total Changes in Assets/Liabilities.
We now turn to cash flow from investing activities — how much the company spent on acquiring the means of production or distribution or, alternately, how much it made on selling business units to other firms. All these figures come off the balance sheet.
Net Changes in Property, Plant & Equipment: If a company’s PP&E increased over the previous period, that suggests it has that much less cash on hand.
Net Changes in Intangible Assets: If the value of a company’s intangibles increased over the previous period, that suggests it has that much less cash on hand.
Net Acquisitions/Divestitures: If a company spends money to buy a business, that suggests it has that much less cash on hand; alternately, if it receives money from the sale of a business, that suggests it has that much more cash on hand. The alert reader who studied the above table will observe that the big news in Kellogg’s 2019 cash flow statement is on this line.
Net Changes in Short-Term Investments: The portion of the following item which is realized or incurred within the past 12 months.
Net Changes in Long-Term Investments: If a company acquires property and equipment or expands its facilities, that suggests it has that much less cash on hand; alternately, if it sells such big-ticket items, that suggests it has that much more cash on hand.
Net Changes in Investments – Total: This is the sum of the above six lines.
Investing Activities – Other: This is a catch-all that covers anything not delineated above. In Kellogg’s case, it refers to changes in pension plan funding.
Cash Flow From Investing Activities: This is the sum of the above two lines. Under most circumstances, this summation ought to be negative because one hopes that the company is acquiring new assets to make more of its core products, adding capacity to make new products or buying more vehicles with which to distribute its wares to the market. Kellogg’s, though, had a positive line here in 2019. That’s because it divested its selected cookies, fruit and fruit flavored snacks, pie crusts, and ice cream cones businesses to Italian candy maker Ferrero in return for $1.3 billion.
Now we move on to cash flows from financing activities. These involve the company issuing or repurchasing its own securities. These lines also capture taking out and repaying bank loans, as well as making dividend payments or rewarding executives for improving the stock price.
Net Long-Term Debt: If a company’s net long-term debt increased over the previous period, that suggests it has that much more cash on hand.
Net Current Debt: The same logic applies to the portion of the preceding item which was incurred within the past 12 months.
Debt Issuance/Retirement Net – Total: If a company issued net debt over the previous period, that suggests it has that much more cash on hand; alternately, if it retired that debt, it should have that much less cash.
Net Common Equity Issued/Repurchased: The same logic applies to equity issuance or buybacks as to debt issuance or retirement.
Total Common and Preferred Stock Dividends Paid: This is the money paid over the period to the company’s owners and represents a reduction in cash.
Financial Activities – Other: This is a catch-all that covers anything not delineated above. In Kellogg’s case, it refers to cash made available by favorable rulings reducing the amount of interest due to tax authorities.
Cash Flow from Financial Activities: This is the sum of the above six lines.
The three bolded lines — Cash Flow from Operating Activities, Cash Flow from Investing Activities and Cash Flow from Financial Activities — add up to Net Cash Flow. This is the bottom line of the cash flow statement.
The company’s reported income statement
You might be wondering where we found the information presented above regarding the Ferrero sale or the favorable tax treatment. It’s all in the footnotes.
At the bottom of a cash flow statement are notes disclosing such details, as well as any significant non-cash exchanges. These often involve some kind of conversion, such as debt-to-equity or lease-to-own. If a company enters into a joint venture with other firms, exchanging a factory and a warehouse in return for a minority stake, that would also rate a footnote.
As noted above, all this is based on a template designed to normalize different companies’ income statements for side-by-side comparison. While there are accounting standards to follow, they do allow for some degree of latitude for how each business delineates its cash flows.
To illustrate the difference, here’s a snapshot of the cash flow statement which appears in the annual report Kellogg’s reported to investors and subsequently filed with the Securities and Exchange Commission.
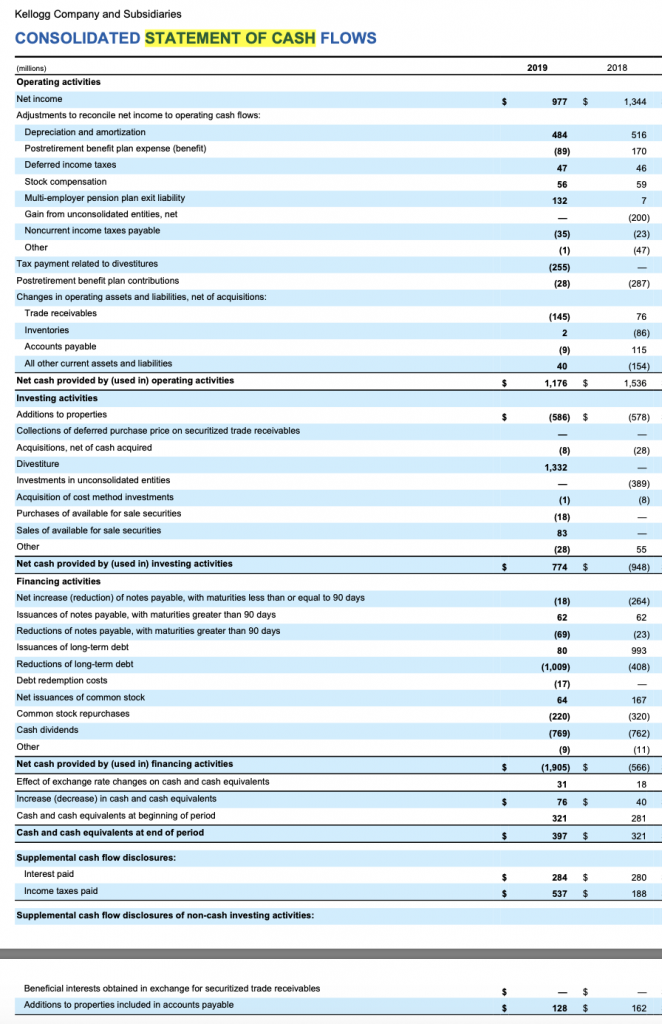
You’ll notice that this meshes with the template, but it’s not the same line-by-line. Both versions start with the same top-line Net Income, but the template is clearer about what’s being solved for: Net Cash Flow. It’s bolded, and the only items below it are the amounts awarded to executives and investors for stock-based compensation and dividends, respectively. In the official filing, you have to hunt around a little for that $76 million “Increase (decrease) in cash and cash equivalents,” which is not auditable at a glance. Further, this line seems to be another input to “Cash and cash equivalents at the end of the period,” which is likely of less importance to investors than the amount of the change from the start of the period.
Kellogg’s does go into greater detail than the template allows, though. Items that the template lumps into Other Non-Cash Items is broken out into nine lines in the company’s rendering of Cash Flow From Operating Activities. While the template nets out acquisitions and divestitures of operating units as well as purchases and sales of short-term investments, both these lines are split by Kellogg’s calculation of Cash Flow From Investing Activities. Contributing to Cash Flow From Financing Activities, we find similar bifurcation with regards to issuance or retirement of debt and equity.
Cash ratios
While $76 million isn’t a lot of cash for a company the size of Kellogg’s, it’s still positive — as opposed to negative — cash flow. That’s a good sign. How good is a matter of analyzing ratios derived from its cash flow statement.
One of the most frequently cited is the operating cash flow ratio:
Operating Cash Flow Ratio = Cash Flow From Operations / Sales
This explains how much of every dollar of sales is retained as cash. It’s similar to net margin, but with cash earnings in the numerator instead of net income. As with net margin, the operating cash flow ratio is a measure of a company’s profitability and efficiency. The higher the number, the better. We know from the exhibits above that Kellogg’s 2019 Cash Flow From Operations was $1.176 billion. To determine its Revenue, we must consult the company’s income statement:
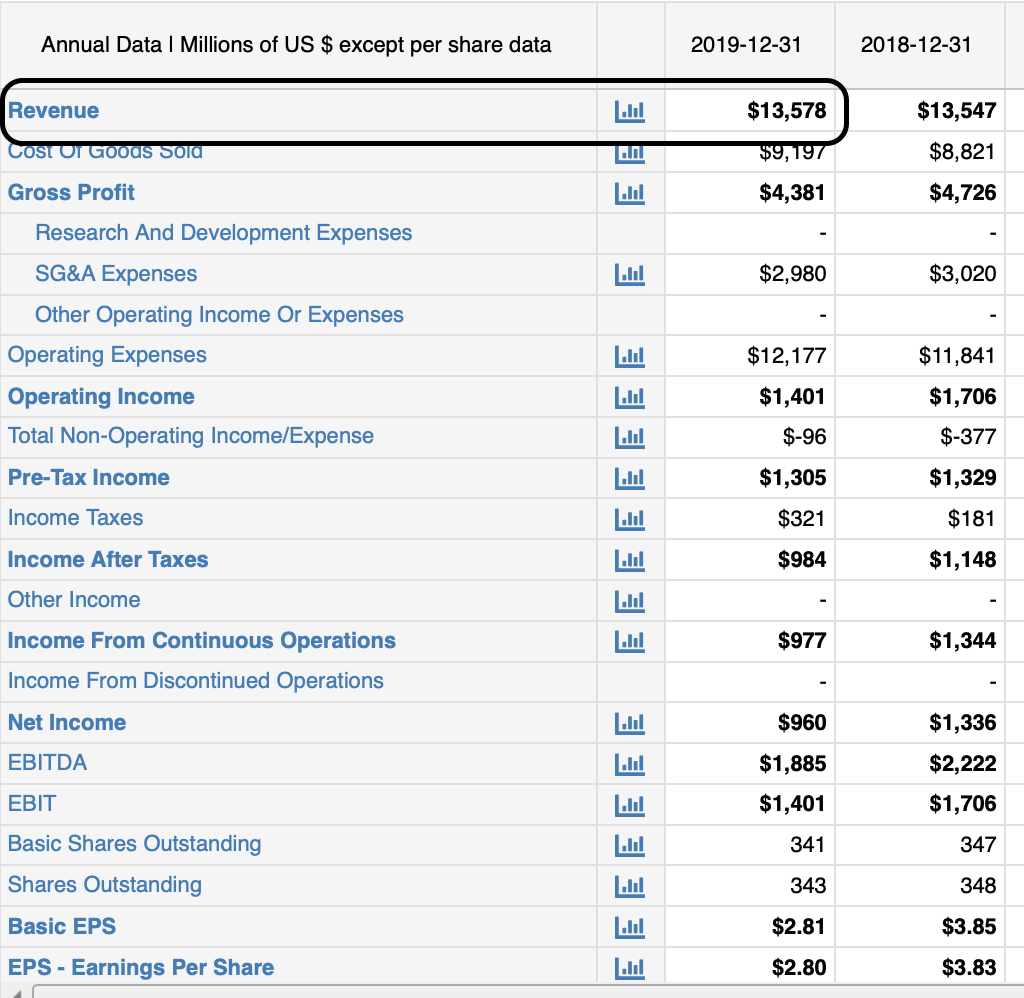
Given Revenue of $13.578 billion, the operating cash flow ratio is 8.7%. To determine if that’s a “good” number, an analyst would compare it to the corresponding figures from industry peers. Kellogg’s major competitors include Post Holdings, General Mills, Campbell Soup and Kraft Heinz.
| Company | Operating Cash Flow Ratio |
| Kellogg’s | 8.7% |
| Post | 11.0% |
| General Mills | 20.9% |
| Campbell | 16.1% |
| Kraft Heinz | 14.2% |
By this metric, Kellogg’s is a laggard. Interestingly, it’s in the middle of the pack when it comes to net margin.
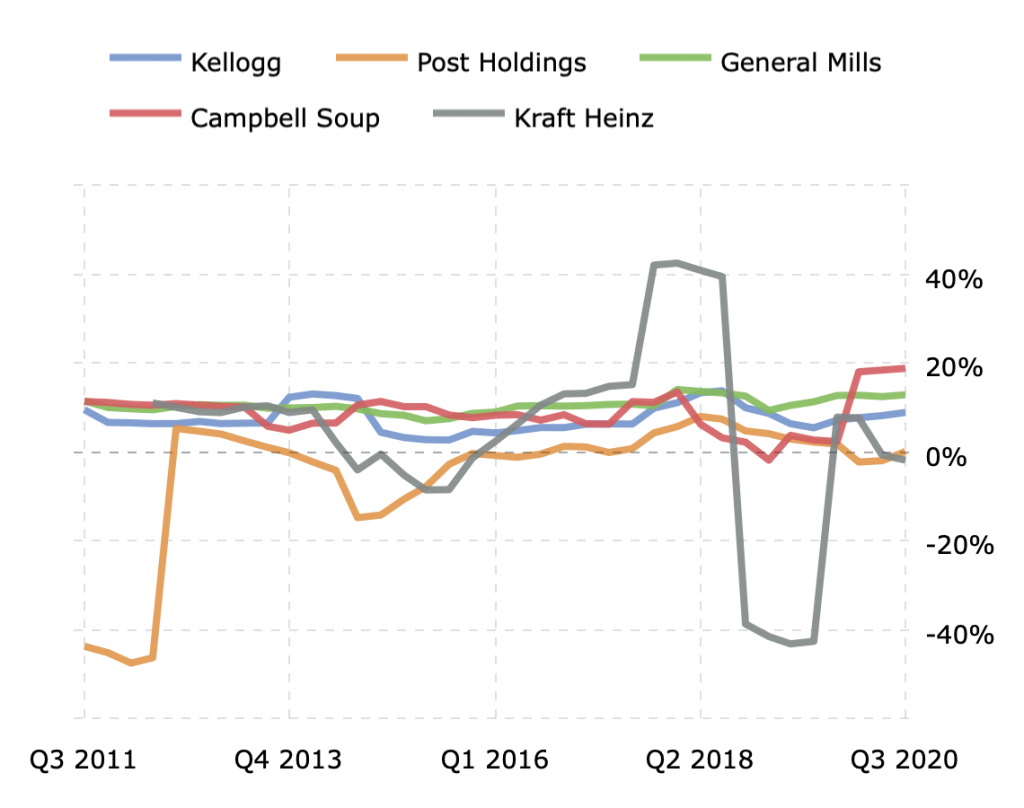
This suggests that Kellogg’s earnings might be of “low quality,” because net income does not appear to be backed up by cash inflows. Meanwhile, Post and Kraft might be “sandbagging” a bit, as they appear to be reporting higher profitability on a cash basis than on an accrual basis.
Other cash ratios provide insight into the company’s solvency, that is, its ability to meet its financial obligations. One example is the current liability coverage ratio.
Current Liability Coverage Ratio =
(Cash Flow From Operating Activities – Dividends Paid) / Current Liabilities
Again, Kellogg’s Cash Flow From Operating Activities was $1.176 billion. Subtract out $0.769 billion in dividends paid, and the remainder is $0.407 billion. For current liabilities, we need to view the company’s balance sheet:
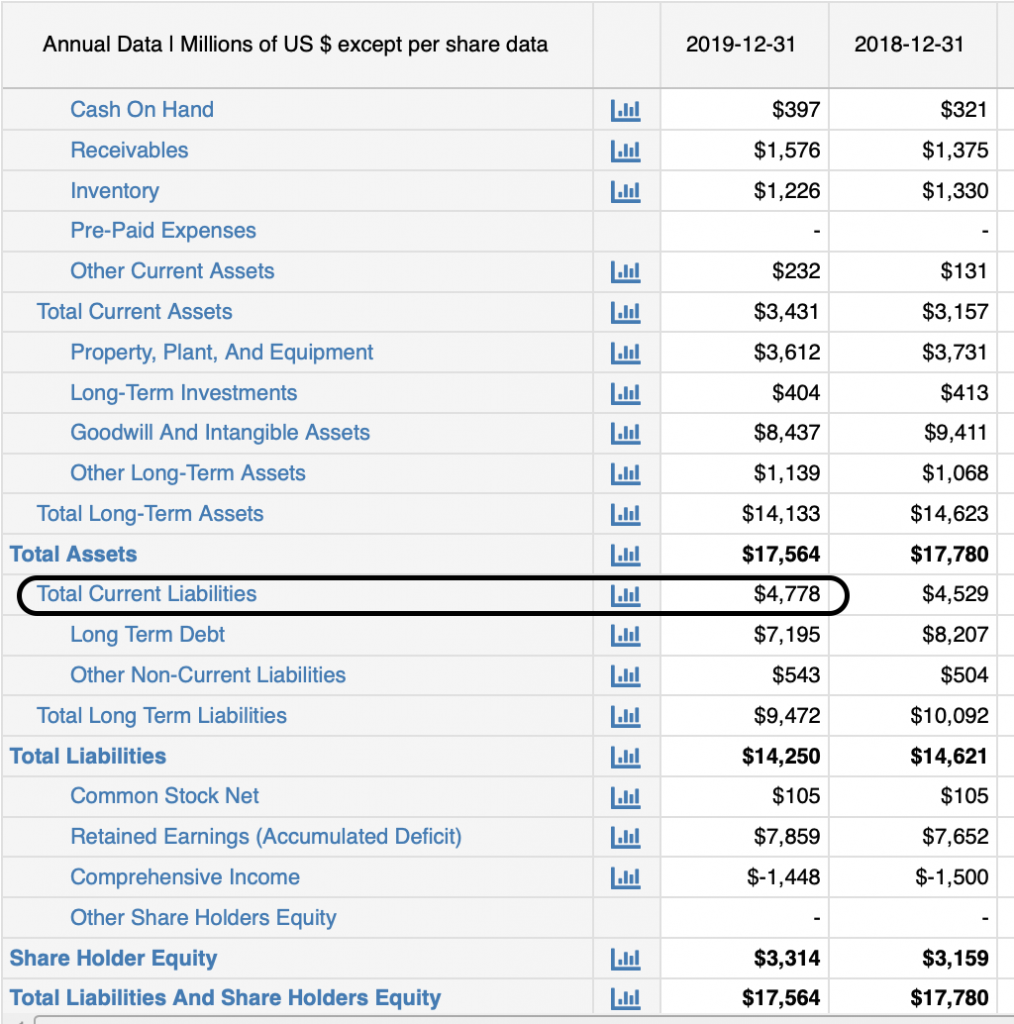
With current liabilities of $4.778 billion, Kellogg’s current liability coverage ratio is 8.5%. That is, it only had enough cash on hand on December 31, 2019, to cover 8.5% of the money it had to pay creditors within the year. This suggests a highly leveraged, possibly insolvent company. And yet, the century-old company is a viable, ongoing concern, with a stock price that’s been trading in a fairly tight range over the previous five years.
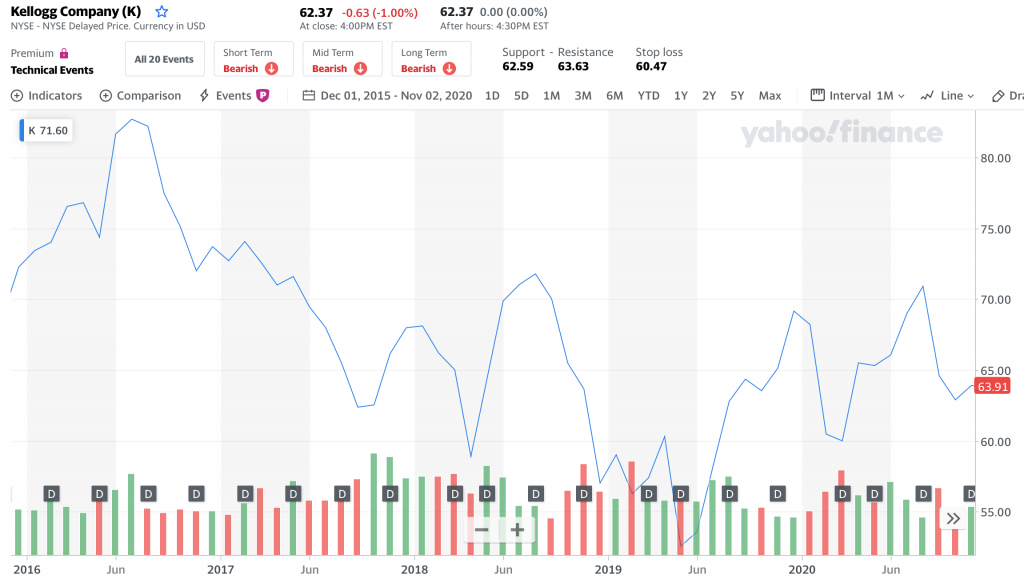
Clearly, investors aren’t panicky. Perhaps it would be instructive to compare Kellogg’s with its peers.
| Company | Curent Liability Coverage Ratio |
| Kellogg’s | 8.5% |
| Post | 64.3% |
| General Mills | 49.1% |
| Campbell | 45.4% |
| Kraft Heinz | 45.1% |
None of these could pay all its short-term liabilities from cash on hand. While Kellogg’s is clearly an order of magnitude less solvent, they are all directionally the same. The main reason why Post appears stronger than its competitors is that the company doesn’t pay a dividend. All these companies need to supplement Cash Flow From Operating Activities with those from investing or financing activities. That is, they are all relying on either selling off businesses or issuing new debt or equity.
Final thoughts
Cash Flow From Operating Activities is sometimes called “Free Cash Flow,” but that’s an imprecise term. In fact, there are several definitions for the term, and most of them arrive at Free Cash Flow without any reference to the cash flow statement.
For that matter, subtracting out the dividend payment to arrive at the current liability coverage ratio is considered optional by many analysts. This omission has the effect of making the stock more attractive.
But these aren’t the only reasons to doubt what you might find on a cash flow statement. If you look at the cash flow statement Kellogg’s submitted to the SEC, you’ll find that inputs which ought to be taken directly from the income statement or balance sheet do not match up precisely. Every bit of daylight is explained in the footnotes, but not everyone would consider that a satisfactory answer.
Cash flow statements in general have other weaknesses.
“Cash from operations can be boosted by turning receivables into long-term investments … or through the use of reverse factoring. … Cash flows also tend to fluctuate more than earnings, making trend analysis more difficult and arguably easier to manipulate,” according to stock analysts Al and Mark Rosen’s article in Canadian finance journal Advisor’s Edge. “Forget the investing platitudes you hear about cash flows. Cash isn’t king; sometimes, cash isn’t even cash. Investing is never that simple.”