EBITDA, the acronym for earnings before interest, taxes, depreciation and amortization, measures a firm’s cash flow prior to the translation into net income. TheStreet.com defines it as “a company’s financial achievement expressed as expenses subtracted from revenue.”
The case is often made that net income, the most widely accepted “bottom line” of corporate finance, is not a tool for all jobs. If the question is, “How much money is available to shareholders?” then net income works very well. But it might not be the best measure of a company’s efficiency and profitability.
Interest expense can warp the results because it’s money going to debtholders who, as valuation consultancy Stout notes, are also investors. Taxes comprise an expense that, at least in most investors’ time horizons, the company’s management has no control over. And depreciation and amortization are essentially accounting functions that have absolutely no bearing on how much cash is flowing into or out of the business.
Key takeaways
- EBITDA is a profitability measure which, unlike net income, treats interest, tax, depreciation and amortization like other expenses.
- It is calculated by adding depreciation and amortization – both non-cash expenses – to operating income.
- It is used by financial analysts to generate ratios to calculate target share prices and by corporate strategy advisors to negotiate mergers and acquisitions.
- While EBITDA provides a more cash flow-based approach to gauging a company’s profitability, it ignores working capital and can be abused by management teams who are over-aggressive with their depreciation and amortization expensing.
The EBITDA formula
EBITDA is calculated using the following equation:
EBITDA = Net Income + Interest + Taxes + Depreciation + Amortization
The first three addends are easy to find on an income statement. They’re usually lumped together as “Operating Profit”. You’ll notice in the following exhibit that interest and taxes are subtracted out of the company’s income immediately after operating profit is calculated. As for EBITDA, you’ll find it below Net Income, but without much guidance as to how the company’s corporate finance department jumped from one figure to the next.
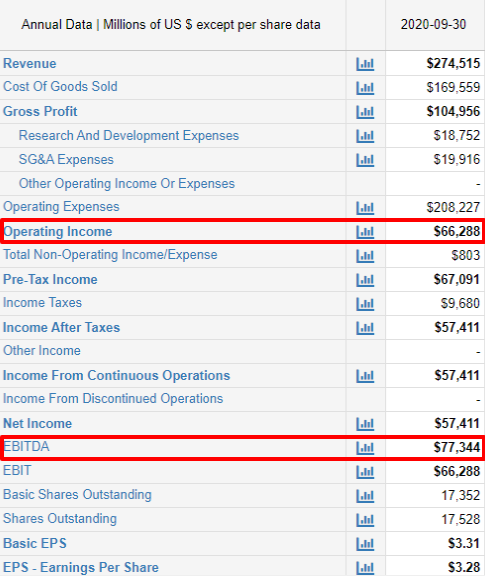
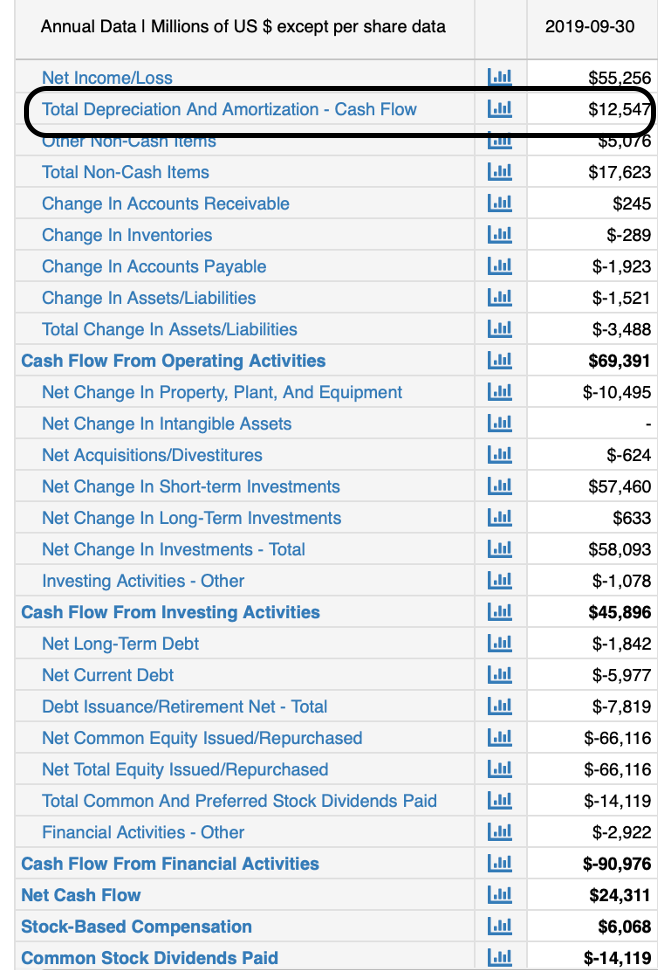
That’s because those last two addends, depreciation and amortization, require a little more digging. You’ll generally find them on the company’s cash flow statement summing to the Cash Flow from Operating Activities total. Since these are non-cash expenses, they’re added back here.
What is considered a good EBITDA?
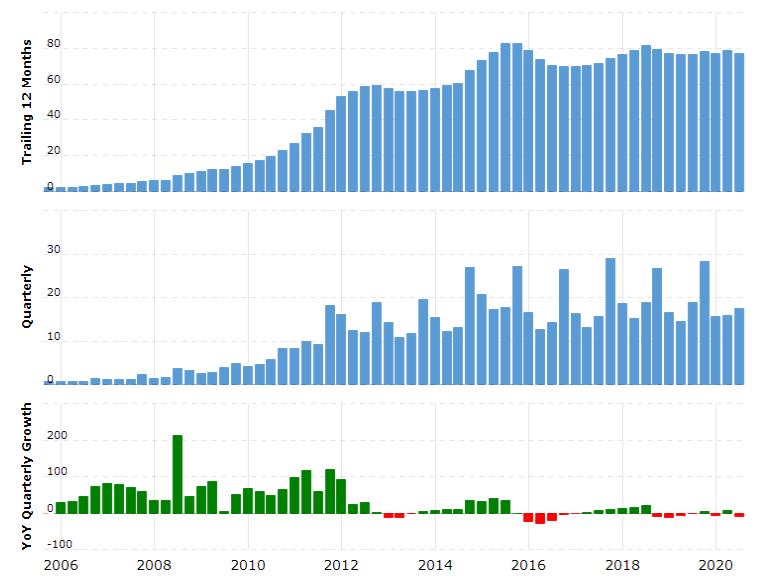
Because EBITDA is a raw number rather than a ratio, there’s no such thing as a “good” or “bad” figure. One thing to pay attention to, though, is if it’s increasing or declining. Increasing suggests that a company is becoming more efficient and profitable over time, as Apple is doing as of this writing, turning around a disappointing 2019.
That said, there are ratios for which EBITDA is an input, and these provide points of comparison between companies. Such comparisons are only valid among companies that are peers of each other in terms of industry and size.
The most widely cited of these is EBITDA margin, calculated as
EBITDA Margin = EBITDA / Total Revenue
which assesses operational profitability and efficiency. This ratio is unique among profitability metrics in that it reveals the current state of a company’s operations without treating interest, taxes and non-cash expenses any different from payroll, materials or any other cost of doing business.
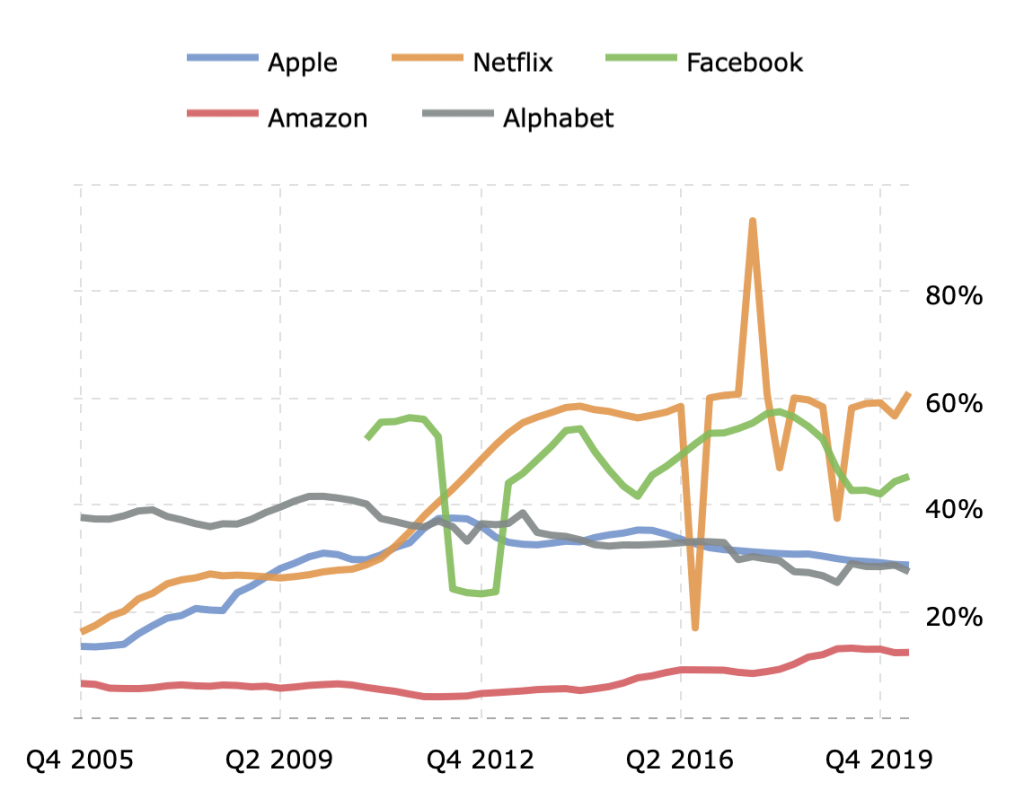
As we can see from the following exhibit, the so-called “FAANG” tech stocks’ EBITDA margins ranged between 12% and 61% in the first quarter of 2020, with Netflix and Facebook performing exceptionally well compared with, say, Amazon. Amazon’s reputation for ruthlessly driving efficiency does not appear to be represented in these numbers.
But this is just one point of information. What happens if we compare these tech giants’ EBITDA margins with the net margins they reported to investors on their income statements? First, you’ll notice that the numbers are more muted – 4% to 31% — likely because amortization of software costs is a major expense.
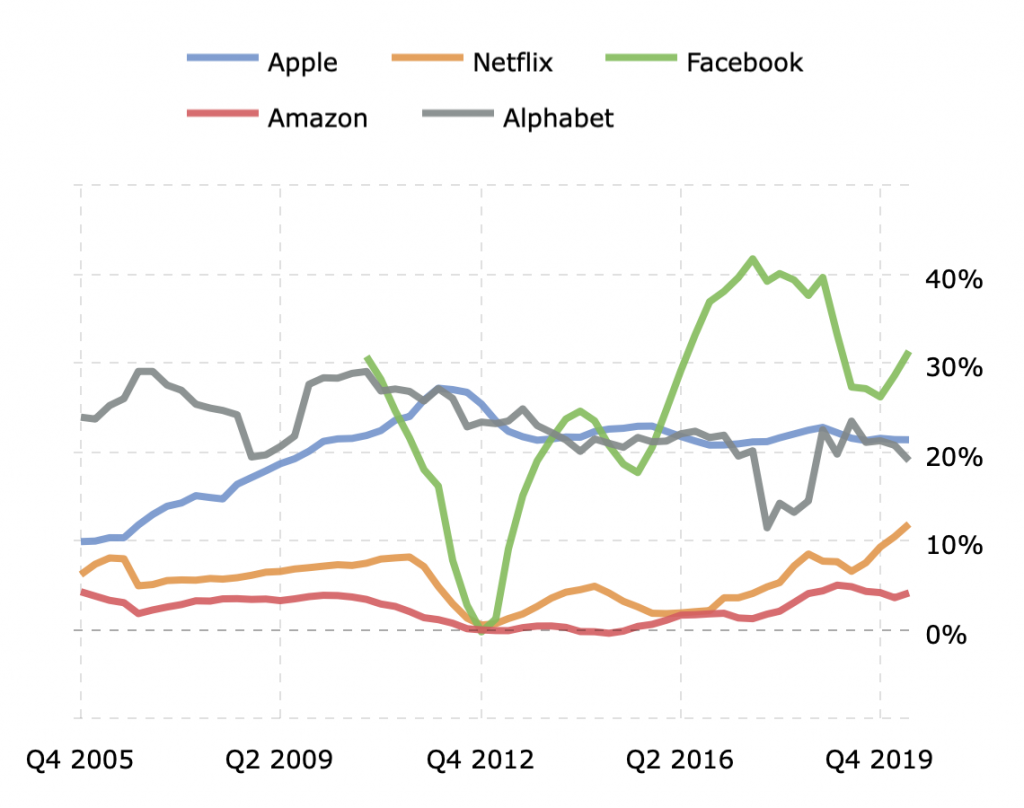
While Facebook still appears to be a strong player as indicated by profitability ratios, Netflix’s comparison suffers materially from reporting its non-cash expenses. (A quick check of the streaming service’s income statement show that interest and taxes are nowhere near as impactful.)
You’ll also notice that Amazon still doesn’t seem to perform well compared to the other FAANGs. But we all know it makes money, so maybe it’s just not a fair comparison. After all, it only competes directly against others on the above two charts in its subscription businesses. It’s also in web services and, of course, retail. So let’s see how its EBITDA ratio compares to Target, Walmart, Oracle and Microsoft.
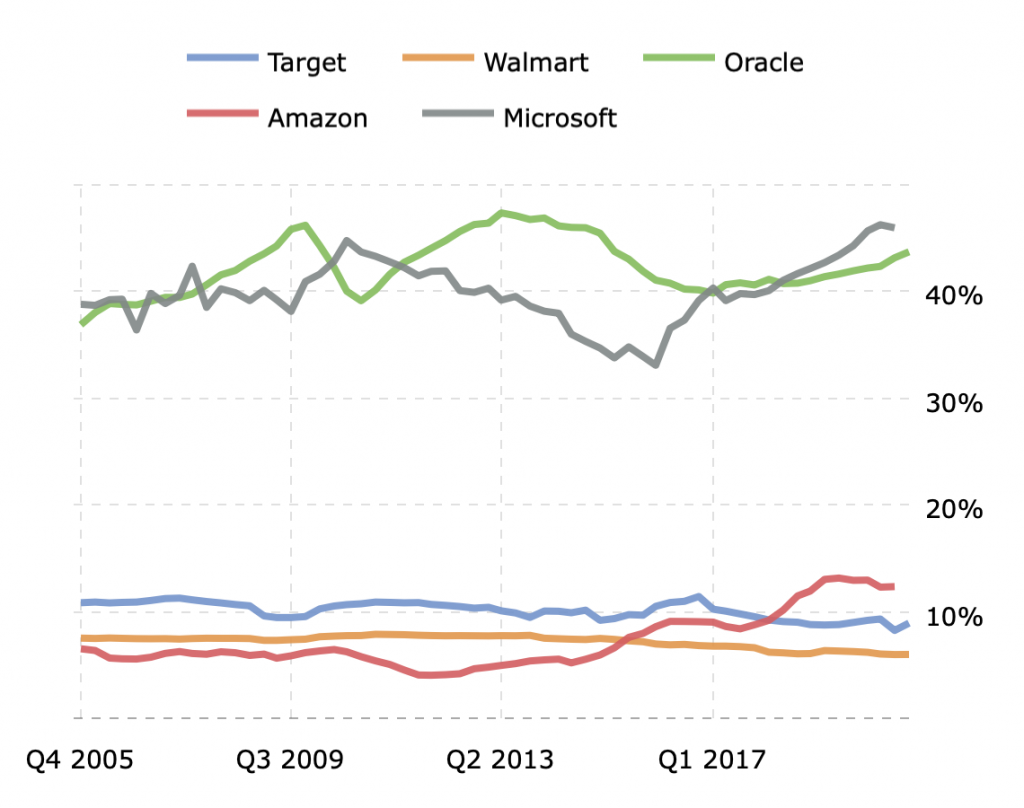
We see that Amazon is actually quite efficient and profitable compared to other major retailers, which constitute its more naturally fitting peer group. Meanwhile, the above chart also shows the difference between companies that are tech pure plays versus those who use technology mainly to distribute real-world goods; while the web services players command EBITDA margins above 40%, retailers’ EBITDA margins cluster from the high single digits to around 12%.
EBITDA and Valuation
EBITDA is of particular interest to the investor community because it informs a key valuation metric, the Enterprise Value to EBITDA ratio, which is computed:
Enterprise Value to EBITDA Ratio = EV / EBITDA
where enterprise value (EV) is the company’s total value:
EV = Market Capitalization + Market Value of Debt – Cash and Equivalents
EV-to-EBITDA thus compares the full value of a company with the amount of EBITDA it earns in a period. It communicates how many times EBITDA investors would have to pay if they wanted to acquire the entire business.
This information provides guidance for analysts modeling target share price values, and corporate strategy advisors negotiating mergers and acquisitions.
EBITDA vs Other Profitability Metrics
As noted before, net income is the accepted measure of a company’s total earnings:
“Net income is preferably used to determine the value of earnings per share of a business, rather than its overall earning potential, which is where EBITDA proves useful,” according to corporate strategy advisory firm Generational Equity.
While there’s a lot of structure defining all the terms nested in this simple equation, net income is calculated as:
Net Income = Revenue – Business Expenses
Operating income is another way of defining a company’s profit. Like EBITDA, it’s also applied when valuing a business. While EBITDA doesn’t distinguish between operating, investing and financing activities, operating income is – as the term itself implies – a measurement of a company’s success stemming from its core operations only. It’s calculated:
Operating Income = Gross Income – Operating Expenses
where
Gross Income = Revenue – Cost of Goods Sold (COGS)
and Operating Expenses are all expenses except COGS, depreciation and amortization.
Operating income is approximately equal – though not necessarily identical to Earnings Before Interest and Tax (EBIT), which is calculated:
EBIT = Revenue – Interest Expense – Tax Expense
Like operating income, EBIT is used in the analysis of a company’s core operations without the impact costs attributable to capital structure or tax jurisdiction. But this raises the question: Why would you use EBIT as opposed to EBITDA?
“Your EBIT analysis will tell you how well a company can do its job, while your EBITDA analysis will estimate what kind of cash spending power that company can have,” Eric Reed writes for the SmartAsset blog. “EBITDA is particularly useful in cases of firms with very heavy capital investments. In these cases, depreciation and amortization can make the company’s operating budget look far less healthy than it actually is, even to the point of showing operating losses despite a steady cash flow.”
Issues with EBITDA
Each of these profitability metrics have their own shortcomings, and EBITDA is no exception. EBITDA can be a misleading measure of liquidity, and does not tell the full story of a company’s access to cash.
It also ignores changes the balance sheet entirely and, while that in itself is not an indictment of a profitability gauge, this means that it ignores working capital. Calculated as:
Working Capital = Current Assets – Current Liabilities
this is the cash a company needs to cover day-to-day operations. This is especially important for fast-growing companies, which require significant investments in current assets such as receivables and inventories to convert their growth into sales.
Similarly, it ignores the property, plant and equipment assets on the balance sheet. This, however, is well out of scope. If EBITDA is designed to smooth over depreciation, then it has to smooth over the hardware that’s being depreciated.
| Metric | Pros | Cons |
|---|---|---|
| EBITDA (EBIT + Depreciation + Amortization) | ● Shows the value of a company’s cash flow and overall profitability from operations. ● Good way to compare similar companies as a % of total revenue, because it ignores depreciation, amortization, debt, and capital expenditures. | ● EBITDA is a misleading measure of liquidity and does not reflect the true value of a company’s liquidity or actual income. ● EBITDA ignores the change in working capital and may overstate cash flow in periods of working capital growth. |
| EBIT (Revenue-COGS-Operating Expenses) | ● Offers a more comprehensive view of a company’s operating income because it includes depreciation and amortization. ● A more truthful look at what a company’s operating income really is than EBITDA. | ● Cannot be considered truly comprehensive, because it ignores a company’s taxes and interest payments. ● Can be used by companies to mislead and cover up financial failures, shortcoming, and levels of debt, because it does not account for interest and taxes |
| Net Income (EBIT-Other Non Operating Expenses-Interest Expense-Tax Expense) | ● The most comprehensive look at a company’s profitability because it accounts for all operating expenses, non-operating expenses, interest expenses, and tax expenses. ● The best way to find how much value a company is truly creating after all their expenses are accounted for. | ● Does not tell investors about a company’s operating income or profit or operating cash flows. ● Only based on past data and assumptions, and does not explain a company’s growth prospects or forecasted cash flows. |
EBITDA standards
According to the U.S. generally accepted accounting principles (GAAP), there is no requirement for companies to disclose their EBITDA. GAAP’s measure of profitability is a carefully defined rendering of net income. Still, EBITDA is easily calculated based on information which GAAP does require to be disclosed.
Because EBITDA is not standardized, it can be calculated under some torturous conditions. While there are accounting standards for establishing depreciation and amortization expenses, these provide a lot of leeway as to what gets written down and what gets expensed, as well as how quickly those write-downs can be realized. This has led to a spate of “adjusted” EBITDA calculations that have puffed up valuations of such disparate firms as software maker Cvent, alternative energy company SolarWinds and even the mixed martial arts league Ultimate Fighting Championship.
EBITDA Examples
So how does this work in practice?
Con10drz is a consortium of six e-sports athletes with more than 10 million followers on their Twitch stream. They make money through ad revenues, product endorsements, personal appearances and sales of both digital and in-real-life merchandise.

They each draw a $75,000 salary, work out of a house that’s been refitted to the point where it’s more like a data center, travel to competitions and buy branded merchandise from a wholesaler. Their high-end gaming computers and webcasting hardware is very expensive, and they have chosen to finance these purchases over time and depreciate their costs. Similarly, they amortize the software they use to operate their hardware and run their business.
Last year, Con10drz earned $1.0 million in total revenues and had the following expenses.
| Salaries | $450,000 |
| Rent & utilities | $75,000 |
| Travel & living | $10,000 |
| Cost of Goods Sold | $100,000 |
| Interest | $15,000 |
| Taxes | $25,000 |
| Depreciation | $15,000 |
| Amortization | $5,000 |
Total expenses, then came to $695,000. Net income, then was $305,000.
To calculate EBITDA, we start with that $305,000, then add back interest, taxes, depreciation and amortization ($15,000 + $25,000 + $15,000 + $5,000), which total $60,000. EBITDA, then, totals $365,000.
But the Con10drz crew is a collection of gamers. Maybe in their next stage of life they’ll have more interest in the rubrics of business management but, for right now, they’re just having fun and pursuing their passion. They’re aware they built something with some market value, and they decide that they’d rather sell the business to a game developer or media company, let someone else deal with the accounting and sell the merchandise, and stay on as employees focused entirely on content. They hire a friend to figure out what Con10drz is worth to a motivated buyer.
The first thing their friend does is calculate EBITDA margin, dividing $365,000 EBITDA by $1.0 million revenues. The result is an EBITDA margin of 36.5%. This suggests that every dollar Con10drz generates in revenues results in 36.5 cents of profits before interest, taxes and non-cash expenses. This figure can be used to compare the company’s efficiency and profitability to other companies regardless of size.
The friend exchanges this information with a few potentially interested parties, then one of two things happens. In the happiest outcome, the friend finds out that a 36.5% EBITDA margin is very good for a Twitch channel, the potential buyers line up in to bid, and the six members of the Con10drz crew each gets a boatload of money.
In the other outcome, the friend finds out that this is actually a low number in this particular industry, that Con10drz was overspending and that a price above the “walk away number” could not be negotiated. But then the crew would know what buyers are looking for. Now they can make corrections and try again next year.