Of all the financial statements companies send out to the investing public, the income statement is perhaps the most important, as it tells the story of the company’s success. While the balance sheet is a point-in-time snapshot, the income statement shows each company’s financial performance over a period of time, typically three months or 12 months. It walks investors through the journey from how much the company sold, to how much it had to spend on inventory, to how much it had to spend on other business expenses, to what kinds of non-operational or one-off events led to non-repeatable gains or losses, all the way to the bottom-line profit.
Key takeaways
- A company’s income statement explains how the company’s expenses over a given period of time reduce its top-line Revenue to its bottom-line profit.
- It differentiates between Cost of Goods Sold, Operating Expenses and Non-Operating Income/Expense.
- It also presents EBITDA and EBIT, efficiency metrics that are related to — but often far different from Net Income.
- Most income statements also present the number of Shares Outstanding, then computes Earnings Per Share.
- There is a certain amount of latitude granted to companies in how they present their expenses; thus, in order to compare them, it’s necessary to go through each company’s filed income statement and restate them in a template.
Income statement defined
An income statement is a report that shows how much revenue a company generated, how much it paid out in expenses and how much was left to claim as profit over a given period of time. That period is driven by how frequently local law or custom requires publicly-traded companies to report their earnings to regulators and investors. Globally, that means every year. In the United States, it also means every quarter — that is, every three months. In most the rest of the world, though, interim reports are required only every six months.
Income statement template
Macrotrends employs a template that traces the descent from “top-line” revenues to “bottom-line” net income. Adopting this widely accepted template provides readers with apples-to-apples points of comparison between companies that might break out their expenses in slightly different manners. There is no one “right” way to define expenses, and companies are afforded a degree of latitude. But there is a standard way, and that’s what we’ll discuss in this section.
To illustrate this template, we’ll use the example of agribusiness conglomerate Archer-Daniels-Midland, usually referred to by its acronym/ticker symbol, ADM.
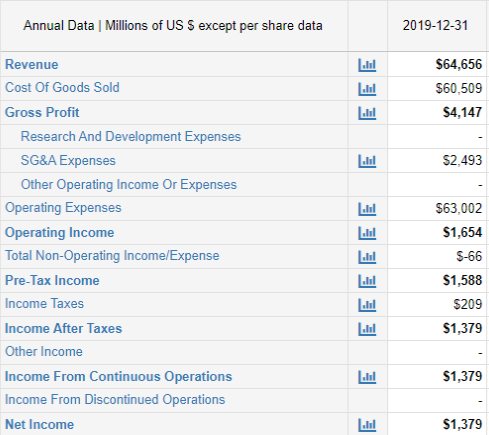
Revenue: At the top of the income statement is Revenue, also called net sales or turnover. This is the value of all goods and services recognized by a company in a given period. “Recognized” is the key word, though. It doesn’t include any refunds or discounts from returned or damaged merchandise.
Cost of Goods Sold (COGS): COGS is comprised of those expenses directly related to inventory.
Gross Profit: Gross Profit, also called Gross Margin, is what’s left when COGS is subtracted from Revenue. This figure illustrates how much a company keeps after deducting just those expenses that are most directly related to offering products and services.
Operating Expenses: Operating Expenses are those costs related to running the business but don’t physically end up getting delivered to customers. Opex, for short, is that money that has to be spent regardless of how many widgets a company makes or sells. These items are generally costs having to do with headquarters overhead, management salaries, sales commissions, marketing and such professional services as auditing or legal work. These are lumped together as Selling, General & Administrative (SG&A) expenses. It also includes Research & Development (R&D). What opex doesn’t include are the costs of buying new equipment, vehicles or real estate. Those are capital expenses and dealt with separately. (Sometimes R&D is capitalized, but that’s not critical right now.) Most opex can be attributed to SG&A or R&D, but that’s a matter of convenience, not compliance; Other Operating Expense could be anything.
Operating Income: You subtract opex from Gross Profit to arrive at Operating Income.
Non-Operating Income/Expense: Non-Operating Income/Expense is money made or lost by a company in a manner peripheral to its main business. That is, it’s money connected to investing or financing activity such as gains or losses from foreign exchange or from hedging strategies used to stabilize the costs of commodity inputs. While such items are part of the regular course of business on a daily basis, this is also the line where companies report such one-off events as selling off a business unit or taking an accounting charge to recognize the cost of a corporate restructuring.
Pre-Tax Income: When Non-Operating Income — net of Non-Operating Expense — is added to Operating Income, the sum is Pre-Tax Income.
Income Taxes: While this should be as easy to compute as multiplying the pre-tax income by the effective tax rate, it rarely is. But this is more often than not to the corporation’s advantage. Such incentives as deferred tax liabilities or the effect of deducting non-cash items like depreciation and amortization as expenses have a tendency to lower tax bills. And of course, if a company takes a loss rather than a profit in a given year, the tax bill would be effectively $0. It’s important to note that there’s some daylight between how taxing authorities compute earnings and how standards for corporate financial reporting do, so the calculation for Income Taxes paid to the government takes place on a different set of books than are presented to investors.
Income After Taxes: After subtracting Income Taxes from Pre-Tax Income, what’s left is Income After Taxes.
Other Income: Often a large company will have income — or loss — from non-controlling interests in smaller companies.
Income From Continuous Operations: Add Other Income to Income After Taxes to arrive at Income From Continuous Operations.
Income From Non-Continuous Operations: Infrequent, unusual or otherwise non-recurring items are recorded separately. These can include proceeds from sales of assets. More frequently, though, this number will be negative due to charges related to layoffs, legal liability or other one-time write-offs. These are separated out from Income From Continuous Operations because, by convention, they are not included in Earnings Per Share (EPS).
Net Income: The “bottom line” earnings — the profit or loss — that are reported to shareholders. It is almost always identical to Income From Continuous Operations.
Below the bottom line
While Net Income is literally the bottom line when it comes to calculating profit, it’s not the last word in how to interpret that profit.
For one thing, Net Income is calculated by what’s called in accounting the accrual method. There are non-cash as well as cash costs included, so it’s not always the best illustration of how much money has been added to the company’s coffers. Secondly, it includes such cash costs as interest and taxes, over which even the most effective management team has limited ability to control over the course of a year.
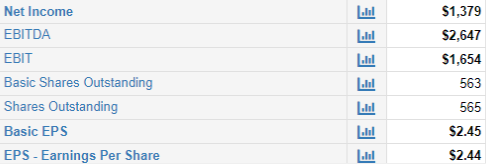
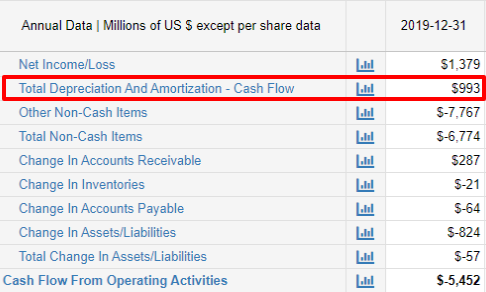
EBITDA: Earnings Before Interest, Taxes, Depreciation and Amortization (EBITDA) is a profitability measure which, unlike Net Income, treats interest, tax, depreciation and amortization like other expenses. It’s calculated by adding depreciation and amortization – both non-cash expenses – to Operating Income. It should be noted that Depreciation and Amortization are not found on Macrotrends’ income statement template. You need to look at the company’s cash flow statement to add it back in. Here’s the relevant portion of ADM’s:
EBIT: Earnings Before Interest and Tax (EBIT) is approximately equal – though not necessarily identical to — Operating Income. Like operating income, EBIT is used in the analysis of a company’s core operations without the impact costs attributable to capital structure or tax jurisdiction. To compute, you start with Net Income, then add back Interest Expense and Income Taxes. Because Macrotrends’ income statement template aggregates Income Taxes with Total Non-Operating Income/Expense it can’t be parsed out without looking at the company’s income statement as reported to investors and filed with the Securities and Exchange Commission. Here is the link to ADM’s.
Basic Shares Outstanding: A company’s quantity of shares outstanding is the number of shares investors own, but there are two ways to express it: basic and fully diluted. Basic Shares Outstanding counts the current number of shares floating. It’s the easiest number to calculate, but not necessarily the most useful, even though it’s used to calculate Basic Earnings Per Share.
Shares Outstanding: When you see “Shares Outstanding” without any qualifier, it’s safe to assume this is the fully diluted count, which includes all shares that would be outstanding if all convertible bonds, options, warrants and similar instruments were to be traded in for their stock value. It is this count that’s used to calculate Earnings Per Share (EPS).
Basic Earnings Per Share: By custom, though not by standard or statute, income statements include a calculation of Earnings Per Share (EPS).This is the company’s total net income divided by — in this case — the number of Basic Shares Outstanding.
EPS: Unless otherwise stated, a company’s EPS is generally meant to be its fully diluted EPS — the company’s total net income divided by diluted Shares Outstanding.
EPS is an important tool for stock valuation because it’s an input to the Price Per Earnings ratio, the most widely used measure of how a company is performing versus its peers. It compares the stock price against the trailing twelve-month EPS. Here’s how ADM stacks up against its peers Hormel Foods and Pilgrim’s Pride (N.b.: Many of the largest players in the Agricultural Products are privately held, so they don’t publicly report their financial statements.):
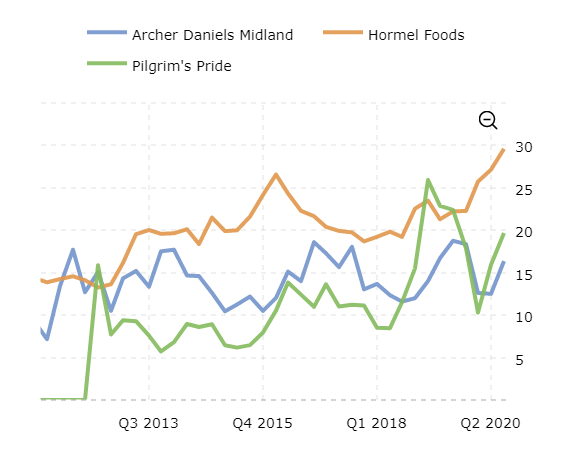
While Pilgrim’s Pride has a history of P/E volatility, it has long since settled into a close rivalry with ADM. Hormel has steadily outperformed them both.
The company’s reported income statement
As noted above, all this is based on a template designed to normalize different companies’ income statements for side-by-side comparison. While there are accounting standards to follow, they do allow for some degree of latitude for how each business delineates its expenses.
As an aside, we should note that there are two standard-setting institutions: the Financial Accounting Standards Board, which promulgates Generally Accepted Accounting Principles (GAAP), and the International Accounting Standards Board, which promulgates International Financial Reporting Standards (IFRS). There’s some daylight in between these two sets of rules and, although the SEC has traditionally favored GAAP, the U.S. financial markets regulator is moving toward a preference for IFRS.
Under either regime, though, there is some allowance for how each company drills down on both operating and non-operating expenses. Above, we linked to the annual report ADM reported to investors and subsequently filed with the SEC. Here’s a snapshot of the income statement which appears in that document:
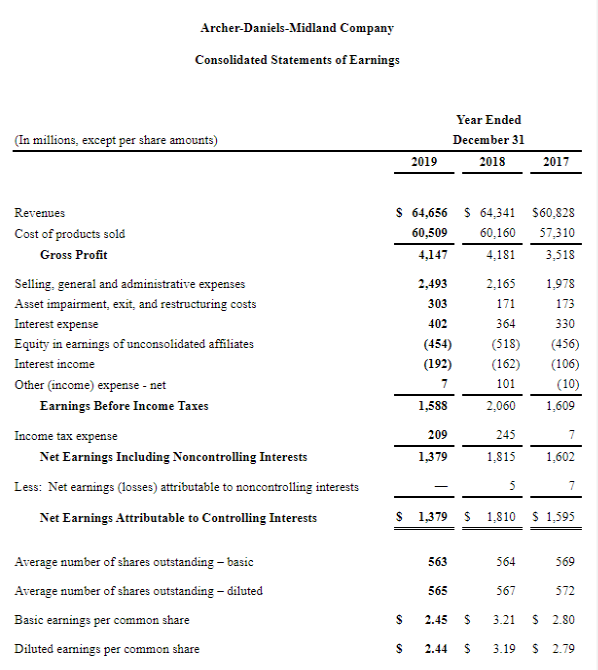
You’ll notice that this meshes with the template, but it’s not the same line-by-line. Both versions start with the same top-line Revenue and end with the same bottom-line Net Income and, given the known shares outstanding, provide the same EPS. Along the way there’s further agreement on COGS and SG&A. But the highlighted lines on ADM’s filed income statement don’t, in the minds of the analysts who filled in the template, fit the definition of Other Operating Income or Expenses. These net out to $66 million in income and, for the sake of comparing with other companies’ results, are judged to be more properly listed on the Non-Operating Income or Expenses line. As a result, there’s a $66 million difference in EBIT.