What is the Net Profit Margin?
The net profit margin, also known as profit margin, is a ratio that takes a complete and comprehensive picture of a company’s profitability. Considered the most conclusive profitability ratio, the net profit margin takes a company’s net income, or bottom line, and seeks to explain how much of each dollar in revenue that a company earns translates into profit.
Other profitability ratios only take into account cost of goods sold, in the instance of gross profit margin, or operating expenses, in the instance of operating margin. The net profit margin takes into account all expenses that a company incurs: non-operating expenses, capital expenditures, interest expense, and tax expenses.
Key Takeaways
- The net profit margin assesses how profitable a company is, and if they are generating enough profit from sales while containing all costs and expenditures.
- Net profit margin is considered the most comprehensive and conclusive profitability ratio, and essential when evaluating a company.
- A net profit margin of 10% and above is considered excellent. However, what constitutes a good profit margin depends on the industry, structure of the business, and health of the broader economy.
Net Profit Margin Formula
The net profit margin is calculated using the following formula:
Net Profit Margin = Net Income / Revenue
To calculate net income, you simply take the operating income (EBIT), and deduct any other non-operating expense, interest expense and tax expense. It is important to note that many of these terms have precise financial definitions:
- Revenue is often used interchangeably with “sales” and refers to the gross income received from normal business operations.
- Operating Income otherwise known as EBIT (Earnings Before Taxes), measures a company’s profits after deducting operating expenses, but before interest payments and taxes are accounted for.
- Operating Expenses sometimes referred to as selling, general, and administrative (SG&A)expenses, refers to expenses that a business incurs in order to function on a day to day basis. In other words, expenses from normal business operations. Some examples of operating expenses could include the following:
- Advertising and marketing
- Maintenance and repairs
- Rent
- Research and Development
- Travel
- Utilities
- Non-Operating Expenses are expenses incurred that are unrelated to the core day to day operations of a business. Examples could include the following:
- Interest expense
- Restructuring expense
- Gain or loss on the selling of an asset
- Dividends paid
- Issuance of shares
- Interest Expense is the expense a company incurs from borrowing money. Companies can represent the interest expense on their income statement based on money borrowed from banks, through bond investors, and other sources.
- Tax Expense is the amount of taxes a company owes within a given period. A company calculates its tax expense by multiplying their income before taxes times the appropriate tax rate.
- Net Income or net earnings, and often referred to as a company’s “bottom line” refers to the income that a company earns, minus all expenses- including costs of goods sold, operating expenses, non-cash expenses such as depreciation and amortization, capital expenditures, other non-operating expenses, and interest and tax expenses.
How to Calculate the Net Profit Margin from the Income Statement
Suppose we wanted to calculate the net profit margin for Coca Cola (KO). This is Coca Cola’s Consolidated Income Statement from their Q2 earnings. We focused specifically on the column with the Q2 figures as of June 26, 2020.
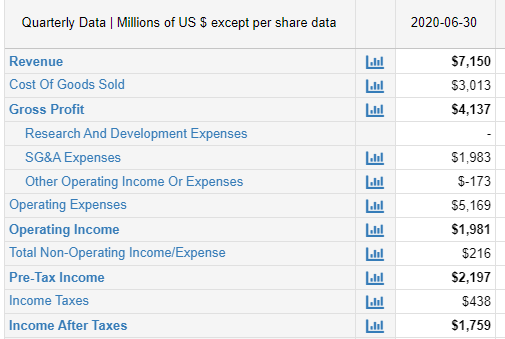
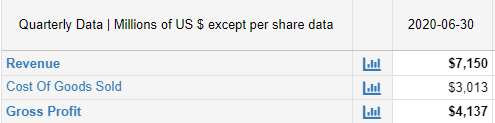
If we wanted to calculate the net profit margin, we simply look through the June 26, 2020 column. Step number 1 is to walk through the income statement and calculate the net income. Notice how the income statement starts with net operating revenues. It then deducts the cost of goods sold, to find the company’s gross profit.
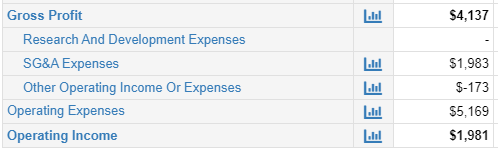
Then, below the gross profit we find Coca Cola’s operating expenses. The only operating expenses listed are selling, general, and administrative expenses, and other operating charges. We then deduct those from the gross profit to find operating income.
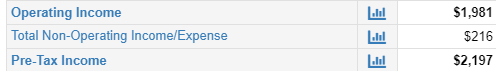
Then, we simply calculate the taxable income, or as its listed here-income before taxes. We take the operating income and add the total non-operating income and expenses to get the income before taxes.
Coca Cola has already calculated the income tax expense on their income statement. So, we simply take the income before taxes, and subtract the tax expense to get income after taxes.
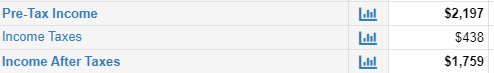
Now that we have the net income, we simply take this value and divide it by the revenue, or as Coca Cola calls it on their income statement “net operating revenues.”
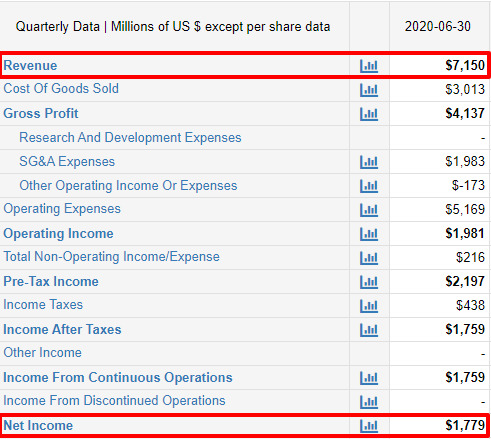
Coca Cola Net Profit Margin = $1.779B / $7.150B = 24.88%
Once computed, we see that Coca Cola’s net profit margin is 24.88% – a very strong number. But the best way to truly evaluate a company’s net profit margin is to see if it is increasing or decreasing over the course of at least 3 years. Like any other profitability ratio, by analyzing multiple years, we can see how a company is trending, and if they should make any adjustments to improve their margin. Let’s calculate Coca Cola’s net profit margin for Q2 2019 and Q2 2018, and see how they are trending.
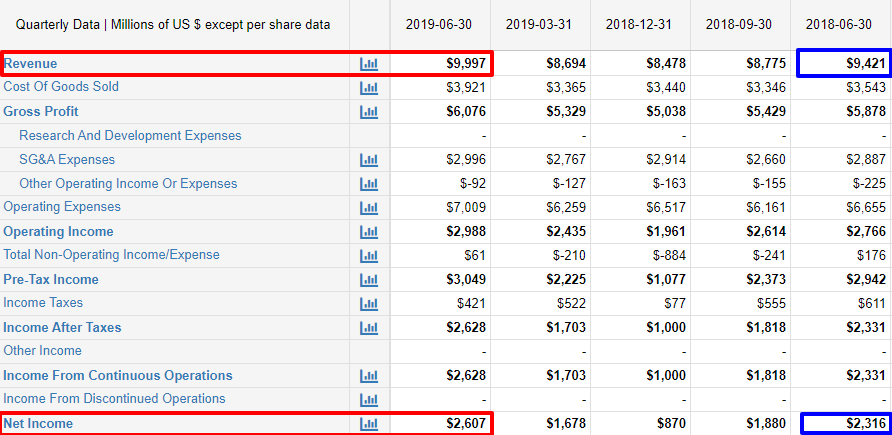
The figures for Q2 2019 are highlighted in red, and the figures for Q2 2018 are highlighted in blue. Let’s now calculate the net profit margins.
Net Profit Margin Q2 2019 = $2,607 / $9,997
= 26.08%
Net Profit Margin Q2 2018= $2,316 / $9,421
= 24.58%
If we compare the net profit margins from Q2 2018, Q2 2019, and Q2 2020, we see that Coca Cola has remained relatively stable. Its net profit margin has really been somewhere between 24% and 26% over the last few years. While the net profit margin is not trending upwards, rather sideways, it is not entirely surprising considering that Coca Cola is not a high growth industry such as a tech company. Furthermore, taking the COVID-19 pandemic into consideration, it is hard to imagine consumer goods such as beverages having a growing net profit margin between normal life in 2019, and COVID life in 2020.
What is a Good Net Profit Margin?
Ideally companies want a net profit margin in excess of 10%. However, this is relative to:
- Industry
- Growth Phase
- Company Size
As seen with Coca Cola, the best way to evaluate a company’s net profit margin is to measure it over time in order to see which way it is trending. Companies want to see that their net profit margin is growing or stable because it shows that they are managing their business well and focusing on profitability.
According to Yardeni Research, Inc.’s comprehensive report “S&P 500 Sectors & Industries Profit Margins” as of September 2020, and as of the latest quarter, the average net profit margin for the S&P 500 is 5.7%[1]. It also appears as if it is trending downwards and is below the trailing four quarter average of 7.2%. However, it appears to be slightly up from earlier in the year and is considerably better than the S&P’s negative net profit margin during the financial crisis of 2008.
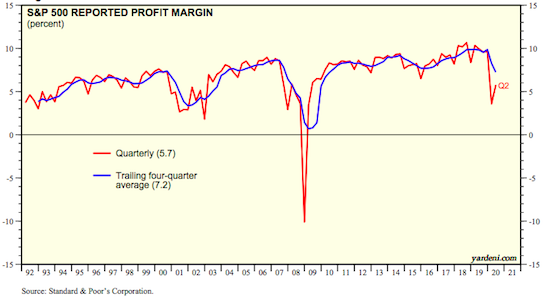
Coca Cola is significantly outperforming the S&P 500 in terms of net profit margin, which is a quite strong position.
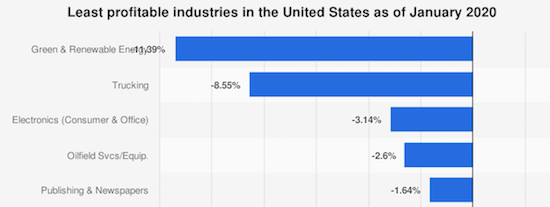
Surely, these numbers have changed with certain sectors such as energy, transportation, and retail being hit disproportionately harder than others during COVID-19, but according to data compiled by NYU’s School of Business as of January 2020, these were the top 5 industries with the lowest net profit margins[2]:
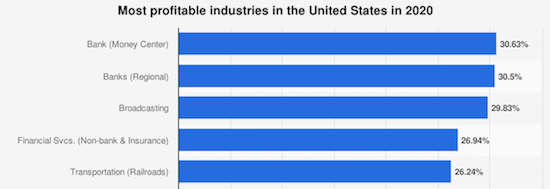
According to this same data, these were the industries with the highest net profit margins. Like the aforementioned data of the industries with the lowest net profit margins, this data surely has changed as well since the beginning of the pandemic[3]:
All of the following reasons might lead to some issues when interpreting the net profit margin:
- Need to Evaluate Over Time Like other profitability margins, this is really not an adequate ratio to evaluate based on a one quarter or one-year value. This is a ratio that you want to compare to other past quarters to see how a company is doing, and how their net profitability is trending.
- Comparability Can Lead to Misleading Ratios Certain industries will have different net profit margins based on a lot of things, inventory being a major one of them. For example, an industry such as a grocery store or airline may have a low net profit margin because their inventory turns over so quickly or they have so many expenses. Other industries, on the other hand, may have a higher net profit margin, simply out of necessity.
- Not an Indicator of Value or Cash Flow An issue with many profitability and liquidity ratios is that none of them take cash flow into account. Profitability is crucial; however, the real lifeblood of a business is their cash flow. This is what truly drives business value. Net profit margin is simply an accounting metric, and while it is more comprehensive than other ratios, because it does not account for cash flow, it still is not telling the full story of a company’s value.
- Very Dependent On All Other Metrics – Many Things Can Skew It Because this is such a comprehensive ratio, if there is any small mishap on accounting, or if there is an unusual event- such as COVID- it can radically skew the ratio and adversely affect it.
Comparing Net Profit Margins of Coca Cola (KO) and Pepsi (PEP)
To see how to evaluate the net profit margin in practice, consider the net profit margins of Coca Cola (KO) and Pepsi (PEP). Both are staples in the food and beverage space, and are considered to be blue chip, large cap, stable American companies. They are also direct competitors. Comparing the net profit margin over the last 3 years is a good quick way to compare two companies that are directly competing with one another, because it shows who is managing their revenue vs. expenses more efficiently, who is simply more profitable, and who is doing it better over time.
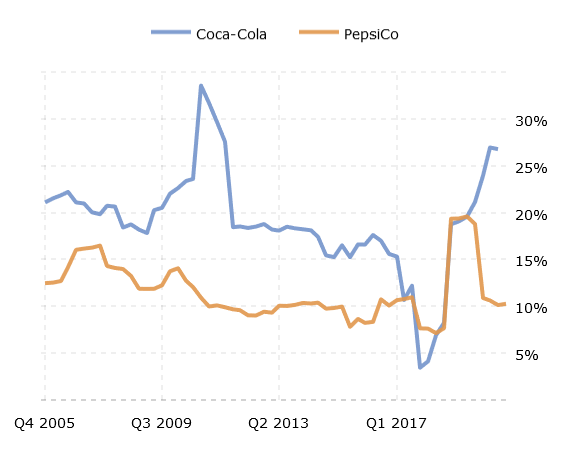
From Q2 2018 to Q2 2019, according to this chart, Coca Cola and Pepsi’s net profit margin were virtually in lockstep with each other. Then, from Q2 2019 until Q2 2020, their net profit margins were almost inversely related. While Coca Cola’s net profit began trending upwards, Pepsi’s began trending downwards. This shows that Coca Cola over the last year has been doing a better job at turning a net profit than Pepsi has, and is managing its expenses more efficiently.
Net Profit Margin vs. Gross Margin
While the net profit margin analyzes the most data when being computed, the gross margin, or gross profit margin analyzes the least, and is considered to be the simplest of all the profitability ratios.
The gross margin is calculated using the following formula:
Gross Margin = Gross Profit / Revenue
To calculate the gross profit, you simply take the revenue-cost of goods sold. You then divide that by the revenue.
The gross profit margin, because of its simplicity, and the fact that it does not take any expenses outside of costs of goods into consideration, paints an overly inflated snapshot of a company’s profitability. For example, let’s look at the same income statement that calculated us a net profit margin of 24.60% for Q2 2020. Except this time, we will calculate the gross margin. All we would take is the net operating revenues and divide it by cost of goods sold.
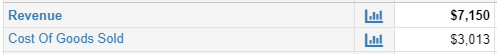
Gross Margin= $3,013 / $7,150 = 42.14%
From this same income statement, we’ve gotten a gross margin that’s nearly double the net profit margin. A gross margin of 42.14% is very good, but it still really distorts the picture. You can see the effect in real time that operating expenses, as well as interest and tax expenses, have on a company’s profit by seeing the difference between these two ratios.
While gross profit margin is a good way to dissect the relationship between a company’s revenue and COGS, and how efficiently a company is producing and selling its products, it really is nothing but a snapshot and not the full story.
Net Profit Margin vs. Operating Margin
While the operating margin tells more of a complete story than the gross margin about how efficient and profitable a company is, it still does not tell the full story as much as the net profit margin does. The operating margin, while it considers all expenses that affect day to day operations, still does not consider all other non-operating expenses, as well as interest expenses and tax expenses like the net profit margin.
As seen in the previous comparison, interest expenses and tax expenses can be a noticeably big chunk of a company’s expenses. This is why the net profit margin is the most conclusive ratio for a business and tells a more complete and comprehensive picture of how profitable a company really is.
The operating margin is calculated using the following formula:
Operating Margin=Operating Income / Revenue
In comparing Coca Cola’s Q2 operating margin with its net profit margin, we can see how much interest and taxes can cut into a company’s profit and tell a more comprehensive and conclusive picture of the state of a business.
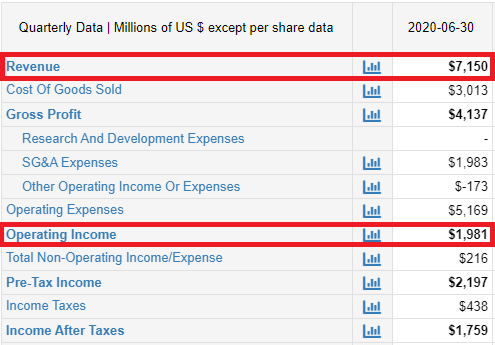
Operating Margin = $1,981 / $7,150 = 27.70%
While Coca Cola’s Q2 2020 operating margin of 27.70% is not terribly off from its Q2 2020 net profit margin of 24.60%, it is still slightly more due to additional expenses which it doesn’t account for. Tech companies such Netflix may have a much larger discrepancy between operating margin and net profit margin, and truly illustrate the differences between the two when it comes to evaluating a company.
To summarize:
| Metric | Pros | Cons |
| Net Profit Margin (Revenue-COGS-Operating Expenses-Other Expenses-Interest-Tax)/Revenue | Very conservative and comprehensive. Can better stand alone as a ratio to evaluate a company in totality. | Because it’s a conclusive ratio, if any ratio goes wrong, or if anything goes wrong with the company, this ratio will be affected. A low profit margin can be misleading on how well or poorly a company is operating. May not leave to evaluate how to lower expenses. |
| Gross Margin (Revenue-COGS/Revenue) | Simplest ratio out of the 3 and gives a snapshot of how effectively the company is producing and selling products. Very easy and useful to forecast future revenues and COGS of company | The least comprehensive of the 3 profitability ratios. Does not effectively measure total profitability. |
| Operating Margin (Revenue-COGS-Operating Expenses)/Revenue | Quick and easy snapshot to show how efficiently a company manages Operating Profit vs. Expenses Effectively shows how good a company is being managed, and its performance. | Does not take into account interest and taxes. Only good as a supplementary ratio and is not comprehensive enough to stand alone. Not sufficient enough to evaluate over 1 year…need to evaluate it over time to see where the company is trending. |
How to Improve a Poor Net Profit Margin
There are a few basic steps firms can take to improve their net profit margin.
- Reduce Expenses: By streamlining and/or automating operations, companies can reduce unnecessary day to day expenses, which will improve its operating margin. With a better operating margin usually comes a better net profit margin. Additionally, if a company finds cheaper alternatives, such as cheaper sources for materials, they can cut costs as well.
- Raise Prices: Although unpopular with customers, this is the easiest way companies can improve its net profit margin. Higher prices + lower expenses = more profit. With more profit, comes better profitability ratios, and the net profit margin will improve.
- Sell More Goods: If a company does not necessarily want to raise prices, they can simply sell more goods and services to boost revenue and improve the net profit margin.
- Trim Non-Operating Expenses: By limiting expenses to only those that are absolutely vital to the day to day functions of the business, and limiting unnecessary non-operating expenses, this can go a long way to improving the net profit margin.
Drawbacks to Profitability Ratios
Profitability ratios are a good way to take a bird’s eye look at how efficiently a company is managed, and how profitable they are. However, the net profit margin is the only ratio that is comprehensive and conclusive enough to adequately analyze a company. However, in general, profitability ratios simply do not take enough things into consideration, including cash flow, assets, and liabilities.
- Difficult to Compare Companies in Different Sectors: Profitability ratios will always be different between industries. Coca Cola will have a different net margin than Netflix who in turn will have a different net margin than Chevron, and so on and so forth. Profitability ratios cannot be the end all be all when it comes to comparing company to company.
- Minor Miscalculations Can Throw the Whole Ratio Off: This is especially relevant for the net profit margin which contains so many different variables and lines from the income statement. If there is even one minor mistake or miscalculation, the whole ratio could be thrown off, and consequently, mislead investors. This can cause serious problems for a company.
- Does Not Evaluate Company Management: All financial ratios, not just profitability ratios, only analyze financial data. Financial ratios do absolutely nothing when evaluating a company’s non-financial attributes – i.e. its quality of management. The quality of a company’s management is arguably as important, if not more important, than its finances. Ratios simply do not do this aspect of a company justice, and do not tell the full story.
- Accounting Practices & Manipulation: Any company in the same industry can use different accounting methods and hacks that can result in misleading numbers. A company’s figures on the balance sheet and income statement largely depend on their accounting practices. Companies can manipulate and play with numbers on their financial statements in order to increase or decrease the ratios depending on their needs, and intentionally mislead investors.
[1] https://www.yardeni.com/pub/sp500margin.pdf
[2] https://www-statista-com.ezp-prod1.hul.harvard.edu/statistics/468436/least-profitable-industries-usa/
[3] https://www-statista-com.ezp-prod1.hul.harvard.edu/statistics/317657/most-profitable-industries-us/