The price-to-earnings ratio, or P/E, is a valuation ratio that compares a company’s common share price to its earnings per share, or EPS. This ratio is one of the simplest and most popular ways to value a company, and enables analysts to determine whether a company’s share price is overvalued or undervalued compared to its peers. This type of analysis is of particular interest to holders or potential buyers of common stock.
Key Takeaways
- P/E is a quick, easy way for analysts to determine whether a company’s common stock is overvalued or undervalued.
- P/E differs from other market multiple ratios in that it only considers stock price and earnings. P/B compares stock price to book value, while P/S compares stock price relative to revenue.
- While simple and useful, P/E is not a comprehensive and conclusive valuation ratio because it does not account for a company’s growth prospects, nor does it consider whether the earnings are actually inflows or only earnings on paper.
- Analysts compare a company’s P/E to those of key competitors or its industry sector, as well as a benchmark index such as the S&P 500.
The P/E formula
P/E is calculated using the following formula:
P/E Ratio = Share Price / EPS
where Share Price is the most recent trading price for a given stock and
EPS = Net Income / Quantity of outstanding shares
There are two quick clarifications to make about EPS. The first is that net income should not include any earnings set aside to pay dividends on preferred stock. These dividends act more like interest payments than they do like common stock dividends, so they aren’t available to holders of the common stock. The other is that the quantity of outstanding shares can vary over time. Sometimes such a change is gradual; for instance, when a company’s management believes the stock price is undervalued, it might buy back shares and retire them. Sometimes the change is sudden, like when a stock splits; in that case, a company that had 100 million shares at the end of the trading day Wednesday could have 200 million or 300 million shares at Thursday’s opening bell.
That said, let’s calculate the EPS for enterprise software maker Salesforce. We would first look to Salesforce’s income statement from the most recently completed fiscal year.
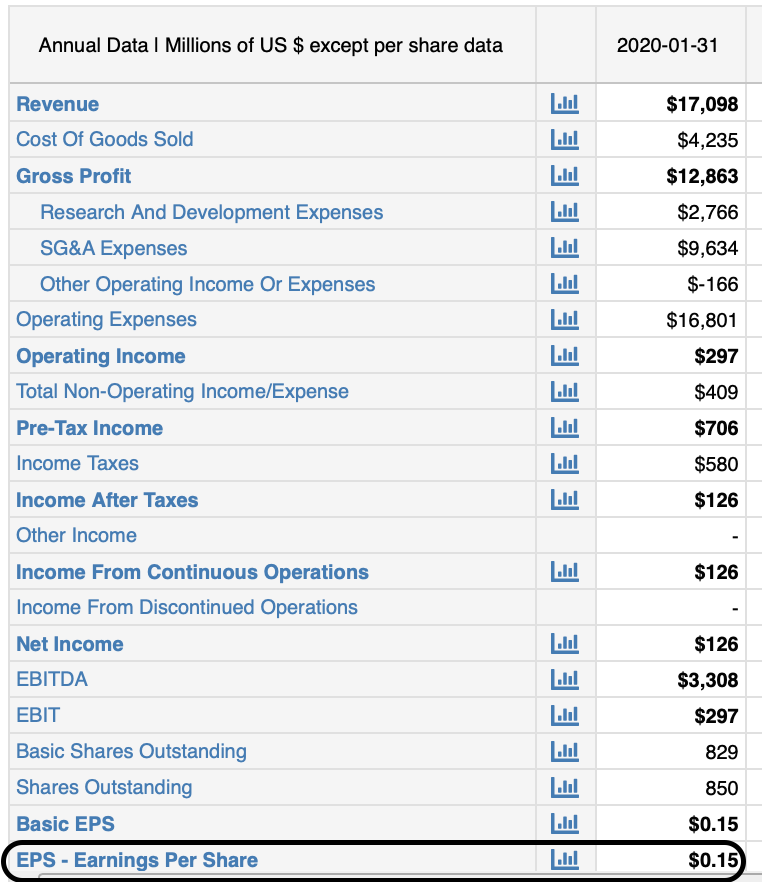
Salesforce makes it easy for analysts and investors to gather this information at a glance; the income statement already lists the company’s EPS as $0.15 per year. That “per year” part is critical. EPS must be expressed in terms of a period of time, which is usually a quarter or a full year. To calculate a ratio such as P/E, most analysts pay more attention to the annual figure. This means that for every share of Saleforce’s stock, the company made $0.15 over the course of the fiscal year ended January 31, 2020.
The Salesforce example demonstrates that, customarily, a company’s EPS can be found at the bottom of its income statement. This custom is so prevalent that it’s easy to forget that this isn’t required by standard or by statute. In the unlikely event that a company’s income statement does not specify its EPS, though, it’s easy to calculate. Simply divide net income by shares outstanding — two lines which you’ll see on any publicly traded company’s income statement.
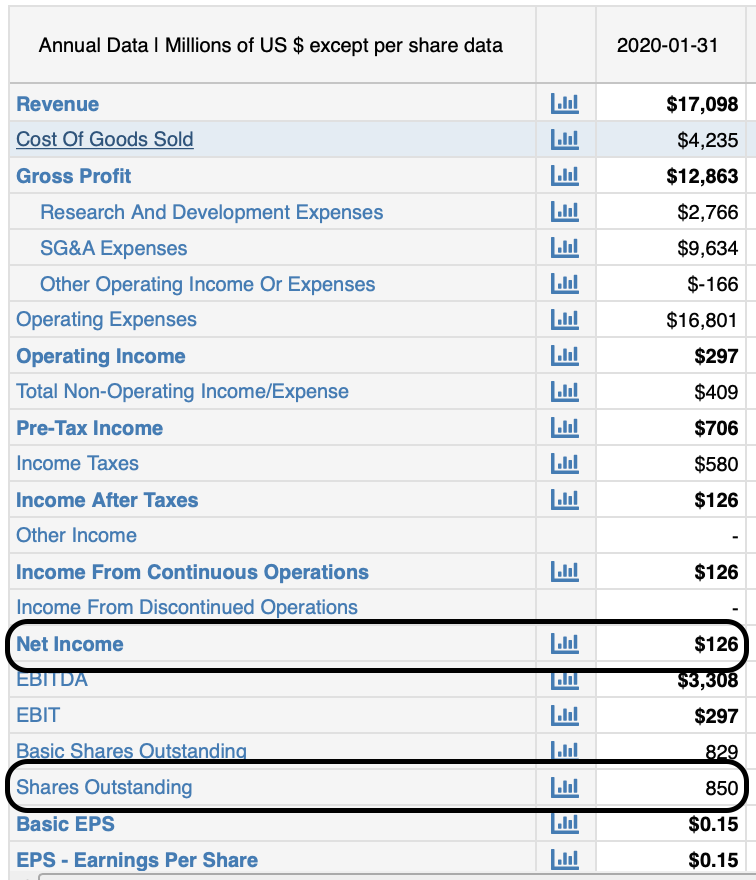
In Salesforce’s case, an analyst would take its annual net income of $126 million and divide that by its 850 million outstanding shares. Once we do that, we get the company’s 12-month EPS:
Salesforce Annual EPS = $126,000,000 / 850,000,000 = $0.15
Once the EPS, is known, the next step is to determine the market price. This doesn’t come from the income statement, but it’s easily culled from any of a number of financial news websites. These include CNBC, CNN Business and Yahoo! Finance, all of which are accessible without a paid subscription. Let’s take a look at what Salesforce’s price was on March 16, 2020, shortly after the $0.15 annual EPS figure were made known:
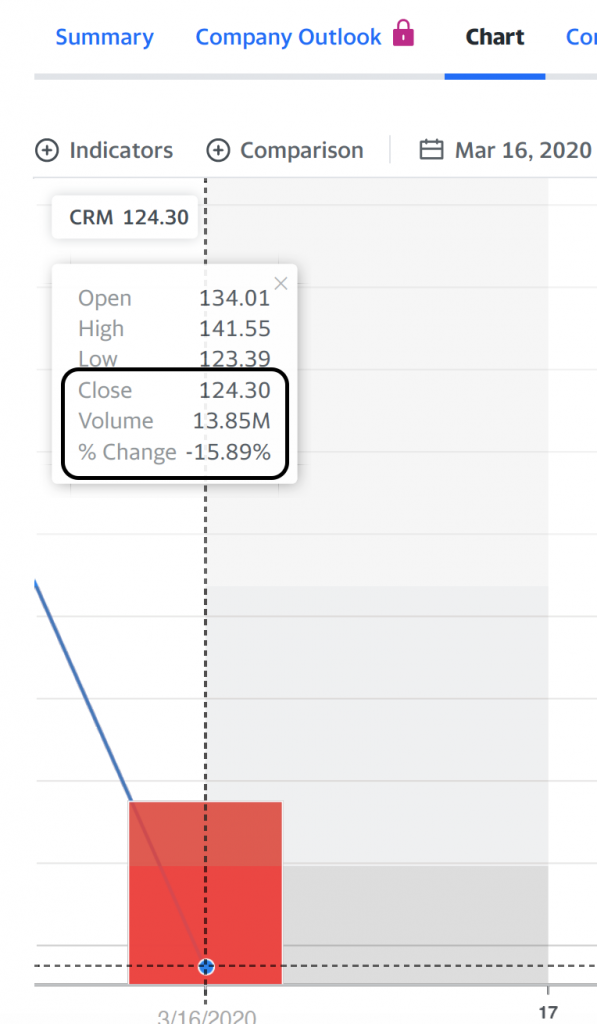
On the news, Salesforce traded at $124.30 per share at the close. Given that, we can now calculate P/E for that date:
Salesforce Annual P/E = $124.30 / $0.15 = 828.7
In this example, Salesforce is currently trading at 828.7x its annual earnings. This ratio is almost surrealistically high and indicates that investors were still willing to pay 828.7 times more than what Salesforce has earned per share over the most recently completed fiscal year — even after taking a 15.89% dive over the course of that trading day. (To be fair, this was also the first trading day after the coronavirus pandemic lockdown went into effect, and almost all stocks traded significantly lower.) While some would consider 828.7x to be overvalued, others would argue that this is the price you have to pay for high potential growth going forward.

What is the Forward P/E Ratio?
To be more specific, we just calculated Salesforce’s trailing twelve month — or TTM — P/E, as of the release date of its Fiscal Year 2019 earnings. For the record, Salesforce’s investors were rewarded for their patience. The TTM EPS as of the date of this writing are $2.51, compared with $0.15 at end-of-fiscal-year. The TTM P/E is a more reasonable — but still high — 92.5. Bottom line: Since March 16, the share price has climbed 87%, from $124.30 to $232.27. Still, this clearly demonstrates the limits of any kind of analysis based on TTM.
As the name suggests, such ratios are based on past data. Investors, though, are more interested in how a company is likely to perform going forward rather than how it has done at any point in the past. This is especially true of high-growth businesses such as Salesforce and its Information Technology sector peers. Thus, we need a different form of P/E that is predicated on forecasted earnings rather than historical earnings.
According to Yahoo! Finance, Salesforce has a consensus projected EPS of $3.75 in 2021. If we divide the current stock price by this projected EPS, we get the following result:
Salesforce Forward P/E Ratio = $232.27 / $3.75 = 61.94
This tells us that in the coming year, we can expect Salesforce to trade with a 61.94 P/E – a ratio significantly lower than today’s 92.5 — and certainly nowhere near the 828.7 in March. However, this number can be problematic for a couple reasons.
First, forward P/E uses estimates, and consolidates a number from a variety of analysts, with potentially different motives. Second, forward P/E may produce incorrect or biased results, and actual future earnings may prove to be different. Unforeseen events are always affecting both individual companies and the economy as a whole. That’s why analysts are very careful to use a disclaimer whenever they provide their clients with forward-looking statements.
What is a Good P/E Ratio?
15.85?
If you think that’s an arbitrary number, you’re right. It’s an average of an average. It’s the mean average of the S&P 500’s aggregate P/E since Henry Varnum Poor started keeping track of railroad share prices in 1857.
To update the number a little, the current S&P 500 aggregate TTM P/E is 32.95. And that is almost as useless a statistic.
But the index’s components represent the entire economy — 69 industries aligned along 11 sectors. Each one of these has an aggregate P/E. If there’s a fair comparison to make, it’s against peers in these groupings. So let’s look at those:
| S&P Sector | 2019 P/E | 2020 P/E |
| Communication Services | 32.70 | 32.20 |
| Consumer Discretionary | 78.92 | 76.81 |
| Consumer Staples | 26.24 | 24.47 |
| Energy | — | — |
| Financials | 14.73 | 10.74 |
| Health Care | 43.47 | 49.58 |
| Industrials | 59.83 | 194.58 |
| Information Technology | 41.46 | 38.71 |
| Materials | 52.14 | 37.39 |
| Real Estate | 52.26 | — |
| Utilities | 27.97 | 32.17 |
Other things being equal, sector-average P/Es don’t jump around much from year to year. Cyclical industries might, like Industrials or Materials. Alternately, a seismic shift in the economy can throw make TTM ratios completely meaningless. The pandemic, for example has fueled growth in Health Care while causing the commercial Real Estate sector to crater.
You’ll notice that the Energy sector has neither a TTM nor a forward P/E. That’s because the industry as a whole was already at the bottom of its business cycle in 2019 then, in 2020, the pandemic-induced recession only made things worse.
It’s important to understand what P/E is intended to measure. It’s not a liquidity ratio, profitability ratio or risk ratio. Rather, it is a market multiple ratio. It simply shows how much money people are willing to pay for a stock today based on its past or future EPS. If one is a value investor, a high P/E may illustrate a stock with unacceptable risk. A high P/E could mean that a stock is overvalued, and its price is too high relative to its earnings.
A growth investor, however, may not care about this – they may be willing to pay 92.5 times earnings for a stock such as Salesforce because they like their growth prospects. On the other hand, a low P/E ratio will attract value investors because they may find that they are trading at a significant discount relative to their earnings.
Furthermore, when assessing a technology company P/E ratio, it should be compared to 5 of its top industry competitors and the tech heavy NASDAQ first. As previously calculated, Salesforce’s TTM P/E ratio is 88.55 while its forward P/E ratio is 67.30. Let’s see how that stacks up to some of its competitors as of October 1, 2020:
| Stock/Index | P/E Ratio (TTM) | P/E Ratio (Forward) |
| Salesforce (CRM) | 88.55 | 67.30 |
| Microsoft (MSFT) | 35.28 | 31.06 |
| Oracle (ORCL) | 18.71 | 14.08 |
| Adobe (ADBE) | 61.77 | 44.05 |
| SAP SE (SAP) | 34.29 | 24.27 |
| NASDAQ 100 | 34.51 | 30.79 |
You’ll note that we compared these stocks not just against one another, but against the Nasdaq 100 index, comprised of a broad array of tech stocks. You’ll note that it’s in the same ballpark as the Information Technology sector as measured by S&P.
Limitations of P/E analysis
All of the following reasons might lead to some issues when interpreting P/E:
- Not Always Reliable For Companies With Negative Earnings: P/E is not always reliable when it comes to evaluating companies that have either negative earnings or considerable debt.
- Subjective Interpretation: This is neither a ratio based off of the actual balance sheet of a company, more based exclusively off their income statement, nor an indicator of cash flow. Rather, P/E simply shows how much investors are willing to pay for a stock. And investors, like the rest of us, often have difficulty distinguishing between reason and rationalization.
- Comparability Can Lead to Misleading Interpretations: Like any other ratio, P/E must be compared to direct competitors and the broader index. Certain industries will have different ratios, and a lot of it is based on market sentiment rather than actual fundamentals.
- Does Not Tell The Full Story: While P/E does a good job at indicating if a stock is undervalued or overvalued, it does not account for a company’s growth prospects, nor does it consider whether the earnings are actually inflows or only earnings on paper. Such non-cash charges as depreciation and amortization — as well as such cash expenses as interest, taxes and preferred dividends — can skew accounting results far from the actual results. While forward P/E does this to a degree, it is largely not reliable as it relies on analyst projections rather than actual earnings.
Comparing P/E Ratios of Salesforce (CRM) and CBRE (CBRE)
To see how to understand the P/E ratio in practice, consider the P/E ratios (TTM) of a high-flying tech stock like Salesforce (CRM) and a commercial real estate stock such as CBRE Group (CBRE). Both are in very different fields and are very different stocks. CRM is a pure growth stock, while CBRE is the quintessential dividend paying real estate stock.
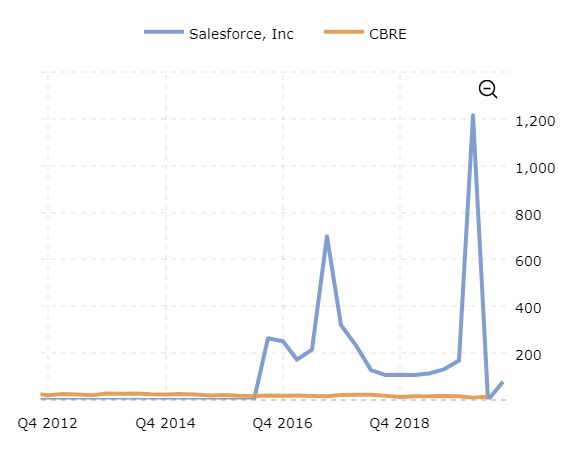
Over the last 8 years, notice how much higher Salesforce’s P/E is than CBRE. Not only that, notice how much more Salesforce’s P/E fluctuated compared to CBRE. This indicates a stock that has considerably more price swings than CBRE, and a stock that investors are willing to pay a higher multiple for just for its growth prospects. While Salesforce’s P/E in this chart is 88.55, CBRE’s is just 13.51. Salesforce has also had a return of over 1600% since 2008, while CBRE has had a return of around 125%.
P/E vs. other price ratios
Let’s first compare the P/E to the price-to-book ratio, or P/B, which is calculated as:
P/B = Share Price / Book Value Per Share
where Book Value Per Share is a company’s common equity divided by its quantity of shares outstanding.
This ratio is strongly preferred by value investors, because it offers a more tangible valuation of a company than the PE ratio. However, while P/B gives investors a better idea of the types of assets behind a certain stock, it does not work well for all industries. It works better for such asset-heavy sectors such as Financial Services or Real Estate. Such tech names as Salesforce, though, don’t need many to invest s much in assets to produce their products as services.
The next comparison is with the price-to-sales ratio, or P/S ratio, which is calculated as:
P/S = Share Price / Sales Per Share
where Sales Per Share is total revenues divided by the quantity of outstanding shares.
P/S is advantageous in that you can still calculate it even if companies are currently operating at a loss, and is typically more useful when comparing high-growth companies with no profits or companies within the same industry.
P/E Ratio vs P/B Ratio vs P/S Ratio
| Metric | Pros | Cons |
| P/E Ratio Current Price Per Share/Earnings Per Share | Easy to calculate and readily available. Quick and easy benchmark for investors to value of a stock, and compare with competitors and indexes | TTM is based on past data, forward is based on unreliable and possibly untrustworthy projections. Not comprehensive, and does not take into account debt, cash flow, or negative earnings. |
| P/B Ratio Current Price Per Share/Book Value Per Share | The best for conservative investors-offers a more tangible valuation of a company than their earnings. Best ratio to give investors an idea of the types of assets behind certain stocks. | Not helpful when evaluating companies with few assets such as tech companies. Can be especially difficult when comparing or evaluating companies that adhere to different accounting standards – i.e. international companies. |
| P/S Ratio Current Price Per Share/Sales Per Share | Quick and easy snapshot in comparing companies within the same industry. Can still calculate it even if a company is not profitable | Does not consider company profitability. Does not explain the true worth of a company’s sales. A company can make billions in sales yet lose money on every transaction. |