What is Return on Assets (ROA)?
Return on Assets (“ROA”) is a financial ratio that shows the percentage of profit earned in relation to total assets. It tells us how efficient a firm is in utilizing its assets and it is generally expressed as a percentage. The higher the ROA, the more efficient and productive the firm is in utilizing resources.
Key Takeaways
- ROA measures the profits made for each dollar invested in assets.
- What is considered a “good” ROA will depend on what the median range is for the firm’s peers. The ROA factors in the debt taken by the firm, unlike other profitability indicators such as ROE.
- It only makes sense to compare ROA for firms operating in similar industries. This is because the business models for different sectors vary by asset deployment requirement. For e.g. Airlines would be considered asset-heavy, and have a relatively lower ROA as compared to Technology companies, given that they require significantly lesser tangible assets to operate its business.
ROA Formula
The general formula to calculate ROA is given as:
ROA = (Net Income) / Average Total Assets
Before proceeding, it’s worth noting that many of these terms have precise financial meanings, which might differ from their commonsense usage.
- Net Income is the total income generated, net of expenses and taxes, over a period. It includes interest paid on debt, income tax due to the government, and all operational and non-operational expenses. Operational costs can include cost of goods sold (COGS), administrative and marketing costs as well as amortization and depreciation of equipment and property.
- Average Total Assets is defined as the average of the total assets at the start and end of the period under consideration.
Now before we go any further, it important to address one thing. Some of you may ask why we are using net income in the calculation instead of Net Operating Profit after Tax (“NOPAT”), given that the denominator includes both equity as well as debt. The reason for this is that equity shareholders have a claim on all assets of the company. Let us break it down in another way by defining three terms
- Equity Value: This represents the value of ALL company assets available to ONLY equity shareholders.
- Enterprise Value: This represents the value of ONLY core business assets available to ALL investors (debt, equity & preferred).
So, since we need to pair the income statement item with the corresponding balance sheet item, it would only make sense to pair Net Income (available only to equity shareholders) with Total Assets, which are available to all stockholders.
Since NOPAT includes payments available to all providers of capital (i.e. debt, equity, preferred etc.), it is apt to use it as a numerator to calculate ROIC, since the denominated represents ALL the capital provided by different sources.
We can take the ROA calculation a step further to break it down into two components.
ROA = (Net Income / Revenue) * (Revenue / Total Average Assets)
A company can have a high ROA either by boosting its profit margin or, more efficiently, by using its assets to increase sales. Imagine there is a company with a ROA of 30%. Investors can determine whether that ROA is driven by, say, a profit margin of 10% and asset turnover of 3 times, or a profit margin of 6% and an asset turnover of five times. By knowing what is typical in the company’s sector, investors can determine whether a company is performing better or worse than its peers.
How to Calculate ROA from the Income Statement & Balance Sheet
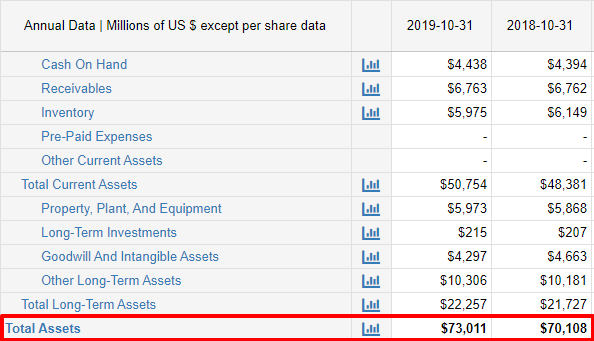
Suppose we wanted to calculate ROA for John Deere (DE), a leading US manufacturer of agricultural equipment. Attached below are screenshots from its recent income statement and balance sheet.
From this we can get the net income of $3.25B. For the total assets, as stated earlier, we will be taking an average figure which can be found highlighted in the screenshot.
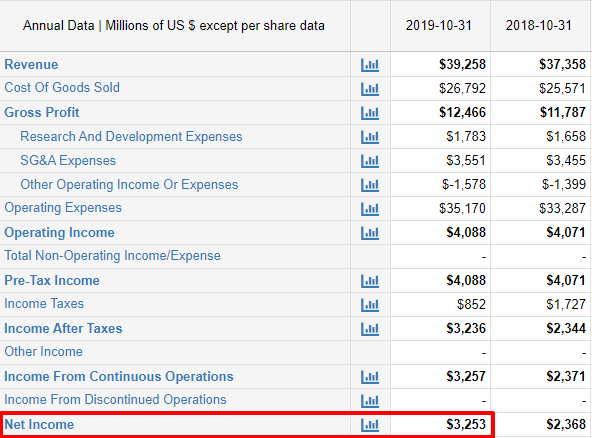
For DE, the ROA can be computed as follows:
ROA = ($3.253B) / (($73.011B + $70.108B)/2) = 4.5%
What is a Good ROA?
As stated before, it is important to evaluate a firm’s ROA vis-à-vis its competitors. For Deere that would include Caterpillar and Paccar.
So, let’s go ahead and pull the ROAs for all the players in the sector and that will give us an idea as to who is deploying their assets most efficiently.
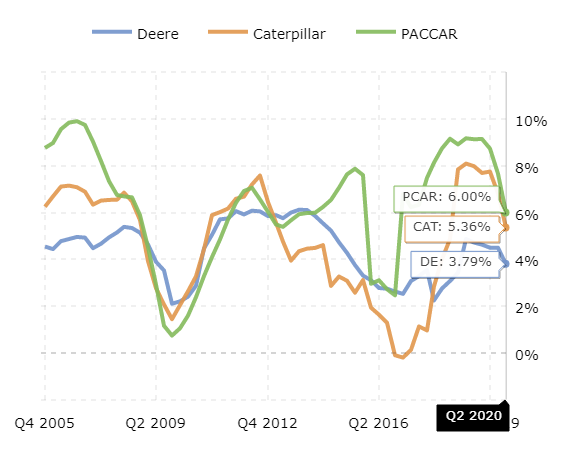
So, as we can clearly see from the screenshot, Deere is not the best performing company in the industry as far as ROA is concerned. Paccar has the highest ROA for this sector with a reading of 6%, followed by Caterpillar.
What it tells us is that for every $1 Paccar invested in its assets, 6 cents are retrieved in the form of net profits.
The first 2 quarters for 2020 have been difficult for all manufacturing enterprises as is evident from the chart above. The lockdown following the Coronavirus outbreak meant that manufacturing companies had to stop production lines which has led to a drop in ROA in 2020. Going forward, growth is expected to return at a much slower pace and hence we can expect a few quarters of a diminished ROA from this sector.
Let us also show the ROA metric for another industry. If were to look at ROA for technology companies, the values would be much higher than what we saw for the three industrial manufacturers above. This is because technology is relatively “asset-light” in comparison to industrials.
We look at a few internet companies including Facebook, Microsoft and Google. Considering that the business model for these companies is relatively asset-light compared with the industrials set, we can expect the ROAs to be significantly higher for this industry.
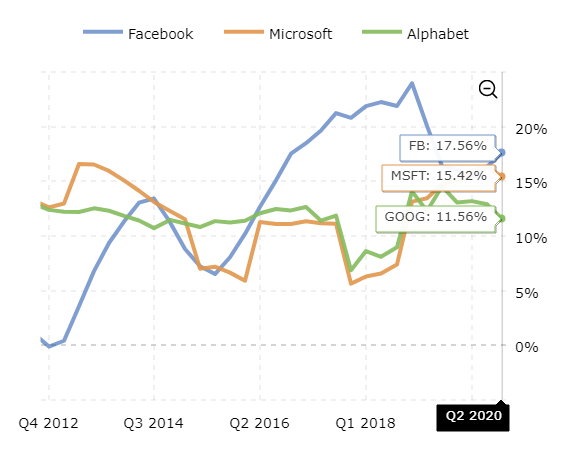
As expected, we can see that the internet companies have a significantly higher ROA compared to the industrials comp set. Facebook seems to be deploying its assets most efficiently, followed by Microsoft.
Let’s quickly take a look at some other sectors to get a sense of the ideal ROA range.
Steel Sector:
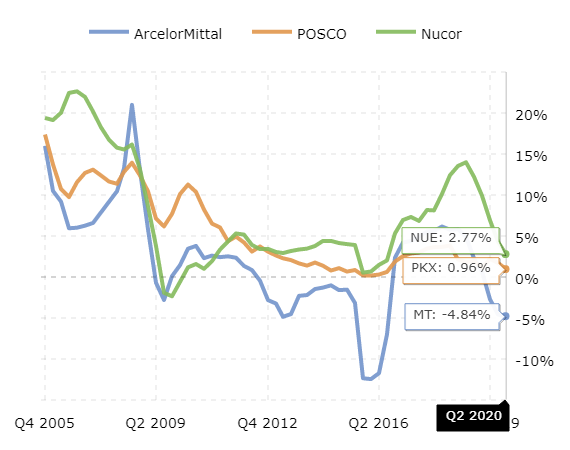
We can see a steady decline over the past many years in the steel industry. Given the cyclical nature of the sector, only those firms with a sound capital structure in place will be able to survive the downturn.
Gold Miners:
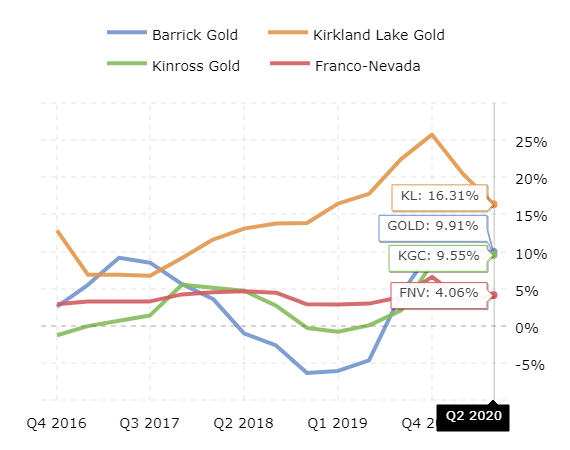
For gold miners, we can see the strong increase in ROA which started in Q1 2019, continuing higher as the price of gold rallies. The price of gold has risen from $1,300/oz to over $1,900/oz over that same period. The strong rally is gold can be seen in the price chart below:
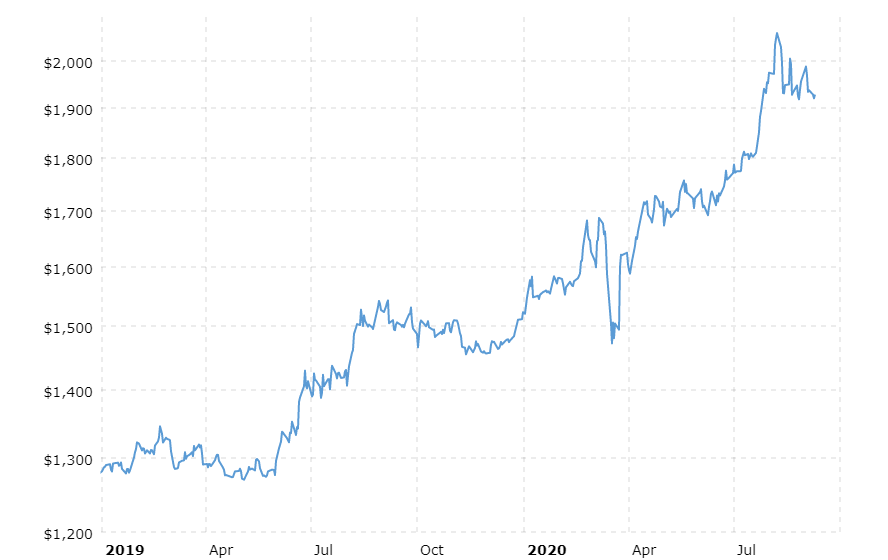
This massive rally in gold bodes well for miners, who will see a drastic uptick in their net profits, and therefore, in their ROAs. We will always notice that when gold rises, gold mining stocks will rise more. This is due to the inherent leverage in the industry.
For example, suppose a company has an all-in sustaining cost to mine gold at $900/oz. Last year, in April, the firm’s margin would have been around $400 ($1,300 – $900). However, after rallying almost 50% since then, the firm’s margin now is around $1000 ($1,900 – $900). We can see from here that even though the price of gold only went up around 50%, the margins of the miner are up 150%. The same assets are now contributing more amount of profit per invested dollar due to the spike in gold prices.
Return on Assets vs. Return on Equity
While ROA measures how effectively a firm is deploying its total assets, which are funded by equity as well as debt, the Return on Equity (ROE) measures how efficiently the equity is being deployed. Hence, ROE will always be greater than ROA.
ROE Formula
The general formula to calculate ROE is given as:
ROE = Net Income / Average Shareholder’s Equity
Before proceeding, it is worth noting that many of these terms have precise financial meanings, which might differ from their common-sense usage.
- Net Income is the total income generated, net of expenses and taxes, over a period.
- Shareholder’s Equity is defined as the owners’ residual claim on assets after all debts have been repaid. In other words, Shareholder’s Equity is equal to a firm’s Total Assets minus its Total Liabilities.
Most analysts follow an industry best practice of using average shareholder’s equity. This is done to negate the mismatch caused by differing Income Statement and Balance Sheet reporting periods. Investors should be aware about the differences between ROA and ROE to remove the risk of confusing the two.
To begin with, ROA helps investors to calculate the profit that a company is expected to produce through all of its assets. On the other hand, ROE lets the investor calculate out the money a firm makes through only its equity funding. It does not consider the use of debt to evaluate the performance of a company.
ROE is arguably the most widely used profitability metric, but many investors quickly recognize that it does not tell you if a company has excessive debt or is using debt to drive returns.
Importance of ROA
ROA is a significant indicator of growth of business operations of a firm. It is a broader concept than ROE and ROIC. An increase in ROA means that wealth is being generated for all stakeholders, as against ROE which creates wealth only for Equity Shareholders. Furthermore, ROIC considers only shareholders and creditors while ignoring current liabilities used to fund operations. It tells how much return has been generated through all capital employed. A decrease in ROA should be seen as a red flag and the management of the firm should work to uncover the underlying reason for this decline.
ROA gives investors a true picture of management’s ability to derive profits from the assets it invests in. The metric also provides a strong insight into net margins and asset turnover, two key performance drivers. ROA helps make the process of analyzing a company much easier, by helping investors differentiate the good quality stocks from the bad pile.
Unlike other profitability ratios such as ROE, ROA calculations include all business assets – it does not matter if they were funded by equity or debt. Though shareholders are primarily interested in the return on their investment, management is more concerned with the way all assets across the firm are being deployed to generate returns.
ROA is also used internally by firms to monitor asset use over time as well as to monitor the firm’s asset deployment efficiency in respect to its peers. It also offers insights into the efficiency of different operations or divisions by comparing them one to the other.
Another use case for ROA involves assessing the benefits of investing in a new project vs. expanding the scope of deployed assets. Here the aim of the management is to increase productivity and income as well as reduce asset costs, thus resulting in an improved ROA metric.
Drawbacks to ROA
Many analysts consider ROA as one the best tools to evaluate a firm’s performance. However, it does have its share of drawbacks as discussed below.
- Can only be used to compare companies operating in the same industry. Some industries are asset-heavy such as airlines & manufacturing, while some are asset-light such as technology and consulting. Hence, it would not make sense to compare ROA across sectors given that the asset deployment percentage will vary significantly.
- Some analysts will argue with regards to what the correct formula for ROA should be. Even though we explained in detail previously why net income is the correct Income Statement metric to use, a lot of variations of this formula do exist. In fact, as per a study conducted by professors at the University of Lipscomb, across different financial textbooks there are 11 listed variations of the ROA formula. This study sampled 77 textbooks to get a consensus on the most widely used variation and it turns out that 40% of textbooks describe the formula we have laid out before. This was the highest for any of the variations examined.
- ROA is prone to manipulation by management to obtain desired results. For example, net income is affected by accounting depreciation which is primarily based on judgment. Another scenario could be when the management has just replaced the old machinery and there is a massive one-time depreciation charge, which could negatively affect net income.
Some analysts argue that ROA is limited in its applications and only makes sense for very select sectors such as banks. This is because bank balance sheets better represent the real value of their assets and liabilities as they are carried at market value, via mark-to-market accounting.